- Data Architecture - Home
- Data Architecture - Introduction
- Data Architecture - Big Data
- Data Architecture - Types of Data Architecture
- Data Architecture - Design Session
- Data Architecture - Relational Data Warehouse
- Data Architecture - Data Lake
- Data Architecture - Data Storage Solutions
- Data Architecture - Data Storage Processes
- Data Architecture - Design Approaches
- Data Architecture - Data Modeling Approaches
- Data Architecture - Data Ingestion Approaches
- Data Architecture - Modern Data Warehouse
- Data Architecture - Data Fabric
- Data Architecture - Data Lakehouse
- Data Architecture - Data Mesh Foundation
Data Architecture - Data Modelling Approaches
Data modeling is an important part of data architecture. It means making a plan for how data will be organized, stored, and used in a system. This chapter looks at different ways to model data, helping you learn how to create useful data models for your organization.
Table of Content
In this chapter, we will cover the following topics related to data modeling:
What is Data Modeling?
Data modeling is an important technique for designing databases. It includes figuring out what data needs to be stored and organizing it into tables and columns to show how different pieces of data relate to each other. This structure can be applied to different types of databases, including relational and NoSQL.
Relational Modeling
Relational modeling was introduced by Edgar F. Codd in 1970. It organizes data into tables(relations), where each table contains rows for records and columns for attributes. This method uses keys to show how tables are related to each other, helping to maintain data accuracy and making it easier to retrieve information.
Keys in Relational Modeling
In relational modeling, keys are important for keeping the database organized and accurate. They help in identifying each record uniquely and show how different tables are connected. Here are some key types.
- Primary Key: This is a unique identifier for each record in a table, like StudentID in a Students table.
- Foreign Key: A foreign key is a column in one table that links to the primary key in another table, creating a relationship. For example, ProductKey in a sales table connects to a product in a products table.
- Natural Key: A unique field that already exists and is used as a primary key, like a Social Security number(a government-issued number that identifies individuals).
Entity-Relationship Diagrams
You usually start relational modeling with an entity-relationship (ER) diagram. This diagram shows the different parts of the database (entities) and how they are connected (relationships). After finishing the ER diagram, you can create a more detailed model that includes the actual tables and columns of the database.
This is how you can create an ER diagram.
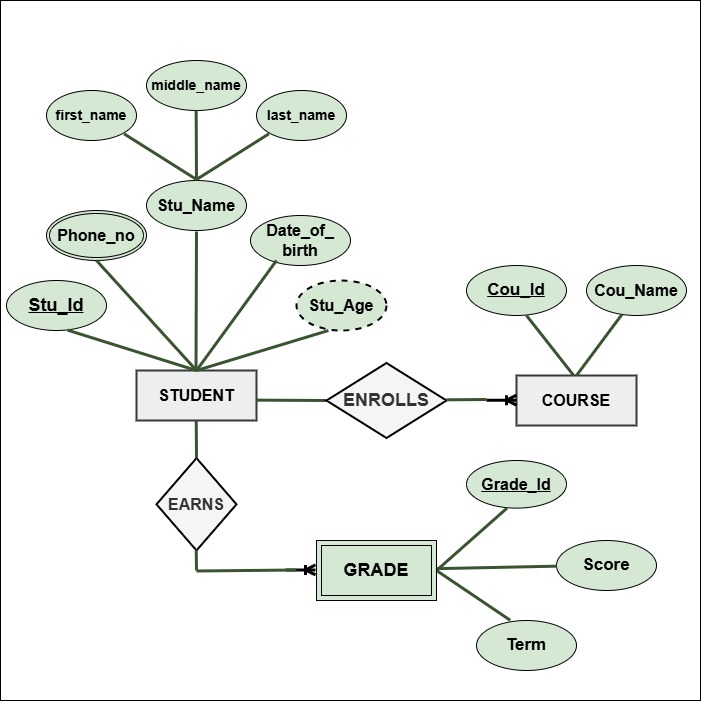
In the above ER diagram, we represent the Student and Course entities. Here's a brief explanation of what we did:
- Entity: The diagram includes two main entities: Student and Course.
- Attributes: The diagram lists attributes for both the Student and Course entities. The Student entity has attributes such as:
- StudentID (a unique identifier)
- Name (composite: First Name, Middle Name, Last Name)
- Phone Numbers (a multi-valued attribute)
- Cou_ID (a unique identifier)
- Name (the name of the course)
- Weak Entity: Grade is a weak entity that depends on both the Student and Course entities.
- Relationships:The Enrolls relationship connects Student and Course, meaning one student can enroll in many courses. The Earns relationship links Student and Grade, showing that one student can receive multiple grades.
- Key Attributes in Relationships:
- The Enrolls relationship may include Enrollment Date and Status.
- The Earns relationship may include Grade Date.
- Composite and Multi-Valued Attributes: The Name attribute of the Student entity is composite, while Phone Numbers is a multi-valued attribute.
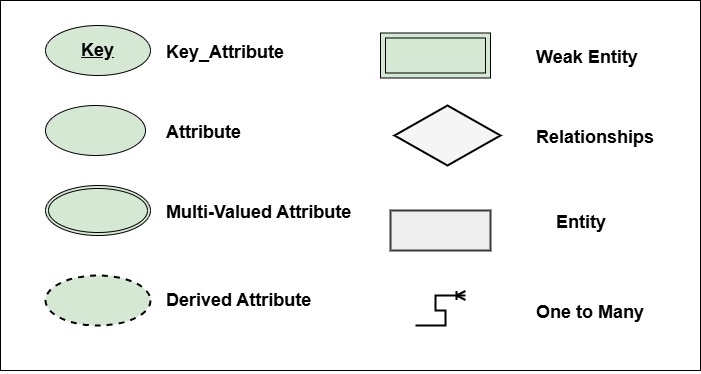
ER Diagram Components
This diagram includes several components that show how entities relate to each other. Below are the key components used in creating the ER diagram.
Normalization Rules for Data Integrity
After creating the ER diagram, you apply normalization. Normalization is a process that takes complex databases and breaks them down into simpler tables. This helps reduce duplicate data and improves the accuracy of the information. The process includes several steps known as normal forms:
- First Normal Forms(1NF): This form makes sure that the table is organized properly. It requires that:
- The table has a primary key.
- Each column has only one value.
- There are no repeating groups of columns.
- Second Normal Form (2NF): Building on 1NF, this form makes sure that:
- It meets all the conditions of 1NF.
- Every non-key column depends only on the primary key.
- Third Normal Form (3NF): Building on 1NF, this form makes sure that:
- It meets all the conditions of 1NF and 2NF.
- Non-key columns must connect directly to the primary key, not through another column.
Tracking Changes with History Tables
In relational databases, it's important to track changes over time. To do this, we use history tables. These tables are copies of the original tables, but they have extra columns that record important details, such as:
- Timestamp: When the change occurred.
- User ID: When the change occurred.
- Before/After Values: The values before the change and the new values after the change.
History tables are very helpful for auditing, reporting, and recovering data. They give you a complete picture of how your data has changed over time.
Dimensional Modeling
Dimensional Modeling began in 1996 to make it easier to analyze and query data. It divides data into two parts: facts(which are the numbers or data points) and dimensions(which provide context, like categories or dates). This method is helpful when regular databases become slow or difficult to use. It usually takes data from these traditional databases to create a more efficient way to analyze information.
Facts in Dimensional Modeling
In dimensional modeling, "facts" are numerical data points that measure specific metrics, such as sales or revenue. These facts can be combined or summarized, like finding averages or totals, which makes it easier to analyze the data. This way, you can quickly discover useful insights from large sets of information.
Dimensions in Dimensional Modeling
In dimensional modeling, "dimensions" help explain the facts. They describe important details about the data, such as time, products, or customer information. Dimensions are often organized into hierarchies, which allows for deeper data analysis. Fact tables store the numerical data, while dimension tables keep the related details that describe this data.
Keys in Dimensional Modeling
In dimensional modeling, we usually use surrogate keys as primary keys instead of natural keys. Surrogate keys are artificial values created specifically to uniquely identify records in a database and are helpful when natural keys are not available or suitable.
Natural keys can provide meaningful information, but they have some downsides.
- They can be longer and more complicated.
- They might contain sensitive information, which can raise privacy issues.
- They can cause duplication or inconsistencies when combining data from different systems.
Tracking Changes in Dimensional Modeling
In dimensional modeling, we track changes in data using slowly changing dimensions (SCDs), which help manage how data changes over time. There are three types.
- Type 1: This type replaces old data with new data. It's used for small changes where we don't need to keep the old information, such as correcting a phone number.
- Type 2: This type keeps both the new and old versions of the data. It's useful for tracking changes over time, like when customers move to new addresses, ensuring that we have accurate historical information.
- Type 3: This type creates a new record for each change, keeping a full history of the data. While it's more complex, it allows us to keep detailed records of all changes.
History Tables vs. Slowly Changing Dimensions
History tables and slowly changing dimensions(SCDs) both track changes in data, but they do so in different ways.
- History Tables: These tables keep a complete history of changes for each individual record. They track every version of a record over time, allowing you to see all the changes made to a specific entry.
- Slowly Changing Dimensions (SCDs): Slowly Changing Dimensions focus on managing changes within dimension tables, which store detailed information about the data. They allow for clear and structured updates using methods like Type 1, Type 2, and Type 3. SCDs ensure that historical data stays accurate and reliable, making it easier to analyze trends over time.
History tables give a full view of all changes for each record, while slowly changing dimensions focus on how dimensional data changes over time. This way, we can be sure that historical information is correct and easy to find.
Denormalization in Dimensional Modeling
Denormalization means copying data into multiple tables in dimensional modeling. This simplifies the database by reducing the number of tables and the number of joins needed, which makes queries run faster and helps you create reports more easily.
However, keeping this copied data consistent can be tough. For example, if a category name changes, it has to be updated in several places in the dimensional model. In a relational model, you only update it once, which helps prevent mistakes.
Comparing Dimensional and Relational Models
In data management, dimensional models and relational models are two different approaches. Dimensional models are designed to make it easier to analyze data, while relational models focus on organizing data accurately.
- Dimensional Models:
- These models are good for analyzing data and understanding business performance.
- They can handle many tables efficiently, speeding up queries and making reporting easier.
- Relational Models:
- These models are easier to set up if the data is organized in standard tables with rows and columns.
- They focus on keeping data correct and reducing duplication, but this can slow down analysis.
Dimensional modeling uses different layouts, like star and snowflake schemas. A star schema has one main table surrounded by other tables, making it clear and simple to understand.
Dimensional models are better for analyzing data, while relational models provide a clear way to manage data. The choice between them depends on what the business needs and how complex the data is.
Common Data Model in Data Modeling
A Common Data Model(CDM) is a standard method for storing and organizing data, particularly in data warehouses. It creates a clear and consistent way to represent data in tables, making it easier for different systems to understand and work with the information.
When importing data from different sources, like various customer relationship management (CRM) systems, it's not practical to use just one system's format. Each system may have different table structures and field names, which can cause confusion. Instead, you should create a new Common Data Model (CDM) that brings all these formats together into one clear structure. This Common Data Model (CDM) will be flexible enough to meet your current and future data needs. Many cloud providers offer easy-to-customize CDMs for specific industries, helping you save time and reduce risks in data integration.
Data Vault Modeling
Data Vault modeling is a way to organize data, developed by Daniel Linstedt in 2000. It provides a flexible and reliable way to manage historical data, making it easier to keep track of changes over time.
A Data Vault model has three main parts:
- Hubs: These are tables that represent important business ideas, like customers or products, with unique IDs.
- Links: These tables show how hubs are related, using keys that connect to the hubs' IDs.
- Satellites: These hold extra details about the hubs or links, like changes over time, and connect through keys.
Disadvantages of Data Vault
While Data Vault offers flexibility and a clear way to manage historical data, it also comes with some challenges that can impact how well it works and how easy it is to set up.
- Complexity: Setting up a Data Vault can be complicated and requires skilled professionals to manage it.
- Data Duplication: Storing detailed data can result in duplicate entries, which can increase storage costs.
- Performance: Having many tables can slow down data retrieval, making queries more complicated.
- Lack of Standardization: Because it's a newer method, it might be hard to find engineers who are experienced in Data Vault.
Kimball and Inmon Data Warehousing Methodologies
This section looks at two main ways to build data warehouses: the Inmon method and the Kimball method. Each has its own benefits and challenges, and the right choice depends on what your organization needs.
Inmon's Top-Down Methodology
The Inmon method starts with a central data warehouse that collects information from different sources. After that, smaller data marts are created for specific departments using data from the central warehouse. This structured approach is often preferred by large organizations that focus on data quality.
The Process in Inmon's Method:
- Data Staging: First, data is quickly collected from different sources into temporary tables without any changes.
- Corporate Information Factory (CIF): Next, the data is organized in a central location, serving as the main source of truth for the organization.
- Dependent Data Marts: After the CIF is set up, smaller data marts are created for different departments, using the central data for their information.
Advantages: This method helps maintain high data quality and works well for larger organizations with complex data needs.
Challenges: It can lead to data duplication, which increases storage costs and makes maintenance more difficult.
Kimball's Bottom-Up Method
The Kimball method starts by collecting raw data into temporary tables called staging tables without cleaning it. This method focuses on creating independent data marts first, which are designed to meet the specific needs of different business areas. These data marts are then connected to provide a complete view of the data.
The Process in Kimball's Method:
- Independent Data Marts: Each data mart is built for a specific department, using simple models to make analysis easier.
- Integration: Data marts are linked through common dimensions, ensuring that all areas stay consistent.
- Cubes for Reporting: Data can be organized into cubes, which makes it easy to look at data from different angles. This helps you quickly find important insights.
Advantages: This method encourages users to participate, which leads to better data management. It also reduces the chances of having the same data stored multiple times.
Challenges: If not managed well, there can be differences between the data marts, which may cause confusion and inaccurate reports.
Differences Between Inmon and Kimball
This section shows the key differences between Inmon'sand Kimball's methods, focusing on how each meets different needs.
- Starting Point: Inmon starts by creating a central data warehouse that collects data from different sources. In contrast, Kimball focuses on building separate data marts from the beginning, targeting the specific needs of different departments.
- Structure: Inmon highlights a physical central data warehouse, which acts as a single source of truth for the organization. Kimball, however, allows for more flexibility, letting organizations create data marts without needing a strict central warehouse.
- Adaptability: Both Inmon and Kimball can adapt to modern data practices, such as using data lakes. This flexibility helps organizations keep up with changing data needs and makes it easier to manage various data sources.
These differences help organizations choose the approach that best fits their needs and goals in managing data.
Hybrid Models
A hybrid model combines parts of both Kimball and Inmon methods. It starts by gathering raw data from various online transaction processing (OLTP) systems into temporary holding tables without cleaning it.
Then, the data is moved to a Corporate Information Factory (CIF), where it is stored in a detailed format. After that, the data is transferred to independent dimensional data marts, which can hold both detailed and summarized data based on what each department needs.
Some data can also be put into cubes for reporting. Using cubes is recommended because they:
- Serve as a clear interface.
- Support multiple users at the same time.
- Provide summarized data for better speed.
- Eliminate complicated joins.
- Include hierarchies and key performance indicators (KPIs).
- Ensure data privacy with row-level security.
- Allow for advanced time calculations for trend analysis.
Using database views in the Extract, Transform, Load (ETL) process can make coding easier and improve querying. Views are virtual tables based on SQL queries, helping to manage complexity without storing extra data.
Mirrored OLTP Systems
A hybrid model involves a mirrored online transaction processing (OLTP) system, which is a duplicate that operates alongside the original system. This arrangement allows the main OLTP to focus on user access and maintenance while data is being collected. It also simplifies the Extract, Transform, Load (ETL) processes and can boost performance by allowing specific indexing without affecting the original system.
Choosing the Right Data Model
There's no one-size-fits-all approach when it comes to choosing a data model. Your decision should consider factors like security, data size, and performance. For example, adding star schemas can improve query performance.
Common Myths About Inmon and Kimball Methods
Here are some common misconceptions about the Inmon and Kimball data methods:
- Kimball is purely bottom-up: In fact, Kimball combines top-down planning with bottom-up execution, focusing on both design and implementation.
- Inmon requires a lot of upfront design: Inmon supports a gradual approach to building data warehouses instead of trying to do everything at once.
- Inmon doesn't support star schemas: In reality, Inmon recognizes the benefits of star schema data marts for easier access by users.
- Few companies use Inmon's method: Surveys show that many organizations actually prefer the Inmon approach.
- The methods are incompatible: Kimball and Inmon can work well together, especially in hybrid models.
Kimball's method includes project planning and maintenance, while Inmon focuses on the data warehouse itself. When people talk about Kimball, they often mean dimensional modeling, which includes techniques like conformed dimensions and snapshot fact tables.
