
Article Categories
- All Categories
-
 Data Structure
-
 Networking
-
 RDBMS
RDBMS
-
 Operating System
-
 Java
Java
-
 MS Excel
-
 iOS
iOS
-
 HTML
HTML
-
 CSS
CSS
-
 Android
-
 Python
-
 C Programming
-
 C++
C++
-
 C#
C#
-
 MongoDB
-
 MySQL
MySQL
-
 Javascript
-
 PHP
PHP
-
 Economics & Finance
Selected Reading
Which is the recommended way to plot – matplotlib or pylab?
pylab is a module that imports matplotlib.pyplot (for plotting) and numpy (for mathematics and working with arrays) in a single namespace.
Although many examples use pylab, it is no longer recommended. For non-interactive plotting, it is suggested to use pyplot to create the figures and then the OO interface for plotting.
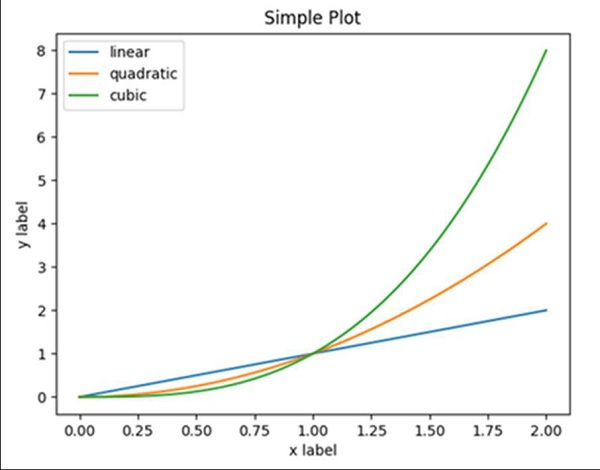
Example
import matplotlib.pyplot as plt
import numpy as np

x = np.linspace(0, 2, 100)

plt.plot(x, x, label='linear')
plt.plot(x, x**2, label='quadratic')
plt.plot(x, x**3, label='cubic')

plt.xlabel('x label')
plt.ylabel('y label')

plt.title("Simple Plot")

plt.legend()
plt.show()
Output

Updated on: 2021-03-16T10:36:48+05:30
364 Views

Advertisements