
Article Categories
- All Categories
-
 Data Structure
-
 Networking
-
 RDBMS
RDBMS
-
 Operating System
-
 Java
Java
-
 MS Excel
-
 iOS
iOS
-
 HTML
HTML
-
 CSS
CSS
-
 Android
-
 Python
-
 C Programming
-
 C++
C++
-
 C#
C#
-
 MongoDB
-
 MySQL
MySQL
-
 Javascript
-
 PHP
PHP
-
 Economics & Finance
Selected Reading
How to force the Y axis to use only integers in Matplotlib?
Whenever Y value list will be made, then we will convert those datasets into a new list, with ceil and floor value of the given list accordingly. Then, we can plot the graph for the new list data.
Steps
Take an input list.
Find the minimum and maximum values in the input list (Step 1).
Create a range between min and max value (Step 2).
Get or set the current tick locations and labels of the Y-axis, with a new list.
Set the X-axis label using plt.xlabel() method.
Set the Y-axis label using plt.ylabel() method.
Set a title for the axes.
To show the figure we can use the plt.show() method.
Example
import math
from matplotlib import pyplot as plt
y = [0.17, 1.17, 2.98, 3.15, 4.11, 5.151]
minimum_ele = min(y)
maximum_ele = max(y)
new_list = range(math.floor(min(y)), math.ceil(max(y))+1)
plt.yticks(new_list)
plt.xlabel("X-axis ")
plt.ylabel("Y-axis ")
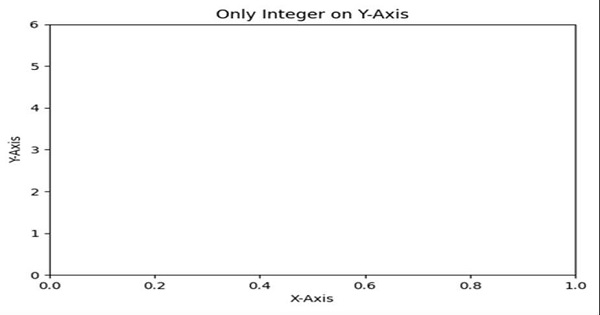
plt.title("Only Integer on Y-axis ")
plt.show()
Output

Updated on: 2021-03-16T10:37:29+05:30
8K+ Views

Advertisements