
Article Categories
- All Categories
-
 Data Structure
-
 Networking
-
 RDBMS
RDBMS
-
 Operating System
-
 Java
Java
-
 MS Excel
-
 iOS
iOS
-
 HTML
HTML
-
 CSS
CSS
-
 Android
-
 Python
-
 C Programming
-
 C++
C++
-
 C#
C#
-
 MongoDB
-
 MySQL
MySQL
-
 Javascript
-
 PHP
PHP
-
 Economics & Finance
Selected Reading
What is the currently correct way to dynamically update plots in Jupyter/iPython?
We can first activate the figure using plt.ion() method. Then, we can update the plot with different sets of values.
Steps
Create fig and ax variables using subplots method, where default nrows and ncols are 1.
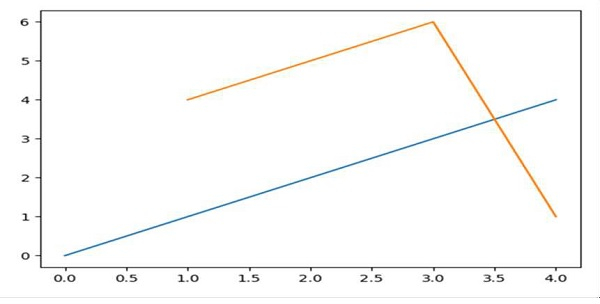
Draw a line, using plot() method.
Set the color of line, i.e., orange.
Activate the interaction, using plt.ion() method.
To make the plots interactive, change the line coordinates.
Example
In [1]: %matplotlib auto

Using matplotlib backend: GTK3Agg

In [2]: import matplotlib.pyplot as plt

# Diagram will get popped up. Let’s update the diagram.
In [3]: fig, ax = plt.subplots()

# Drawing a line
In [4]: ax.plot(range(5))

In [5]: plt.ion()

# updating figures with new lines.
In [6]: ax.plot([1, 3, 4], [4, 6, 1])
Output

Updated on: 2021-03-16T10:15:11+05:30
668 Views

Advertisements