
Article Categories
- All Categories
-
 Data Structure
-
 Networking
-
 RDBMS
RDBMS
-
 Operating System
-
 Java
Java
-
 MS Excel
-
 iOS
iOS
-
 HTML
HTML
-
 CSS
CSS
-
 Android
-
 Python
-
 C Programming
-
 C++
C++
-
 C#
C#
-
 MongoDB
-
 MySQL
MySQL
-
 Javascript
-
 PHP
PHP
-
 Economics & Finance
Selected Reading
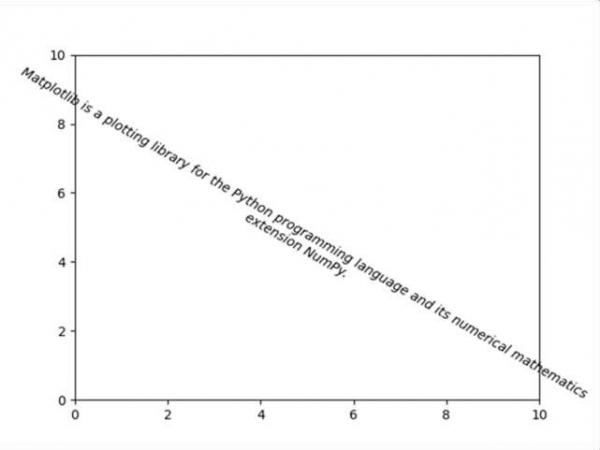
Text box with line wrapping in Matplotlib
Matplotlib can wrap text automatically, but if it's too long, the text will be displayed slightly outside of the boundaries of the axis anyways.
Steps
Create a new figure, or activate an existing figure, using figure().
Set the axis properties using plt.axis() method.
Make a variable input_text to store the string.
Add text to figure, using plt.text() method where style='oblique', ha='center', va='top', ...etc.
To show the figure use plt.show() method.
Example
import matplotlib.pyplot as plt

fig = plt.figure()
plt.axis([0, 10, 0, 10])
input_text = 'Matplotlib is a plotting library for the Python programming
language and its numerical mathematics extension NumPy.'
plt.text(5, 5, input_text, fontsize=10, style='oblique', ha='center', va='top', wrap=True, rotation=-30)

plt.show()
Output

Updated on: 2021-03-17T08:51:16+05:30
2K+ Views

Advertisements