
Article Categories
- All Categories
-
 Data Structure
-
 Networking
-
 RDBMS
RDBMS
-
 Operating System
-
 Java
Java
-
 MS Excel
-
 iOS
iOS
-
 HTML
HTML
-
 CSS
CSS
-
 Android
-
 Python
-
 C Programming
-
 C++
C++
-
 C#
C#
-
 MongoDB
-
 MySQL
MySQL
-
 Javascript
-
 PHP
PHP
-
 Economics & Finance
Selected Reading
Matplotlib figure to image as a numpy array
We can use the following steps to convert a figure into a numpy array −
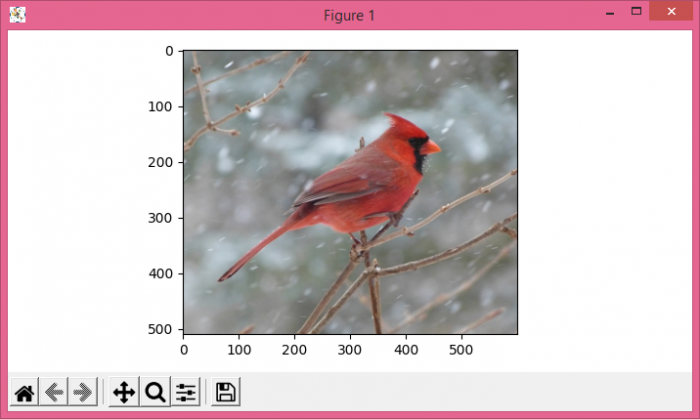
Read a figure from a directory; convert it into numpy array.
Use imshow() method to display the image.
Use show() method to display it.
Example
from matplotlib import pyplot as plt
plt.rcParams["figure.figsize"] = [7.00, 3.50]
plt.rcParams["figure.autolayout"] = True
im = plt.imread("bird.jpg")
print("Numpy array of the image is: ", im)
im = plt.imshow(im)
plt.show()
Output
When we execute the code, it will show "bird.jpg" in a plot and show its numpy array on the console.
Numpy array of the image is: [[[162 162 170]
[162 162 170]
[160 163 170]
...
[ 97 98 92]
[ 98 100 95]
[ 94 96 91]]

[[159 159 167]
[159 159 167]
[157 160 167]
...
[ 94 95 89]
[ 95 97 92]
[ 92 94 89]]

[[157 158 163]
[157 158 163]
[154 157 164]
...
[ 93 94 89]
[ 95 95 93]
[ 95 95 93]]

...

[[163 163 165]
[163 163 165]
[164 164 164]
...
[187 165 151]
[158 131 112]
[133 105 84]]

[[163 163 165]
[163 163 165]
[163 163 163]
...
[160 134 117]
[143 112 92]
[127 96 75]]

[[164 164 166]
[163 163 165]
[163 163 163]
...
[145 116 98]
[129 98 78]
[124 92 71]]]

Updated on: 2021-05-07T07:59:03+05:30
3K+ Views

Advertisements