
Article Categories
- All Categories
-
 Data Structure
-
 Networking
-
 RDBMS
RDBMS
-
 Operating System
-
 Java
Java
-
 MS Excel
-
 iOS
iOS
-
 HTML
HTML
-
 CSS
CSS
-
 Android
-
 Python
-
 C Programming
-
 C++
C++
-
 C#
C#
-
 MongoDB
-
 MySQL
MySQL
-
 Javascript
-
 PHP
PHP
-
 Economics & Finance
Selected Reading
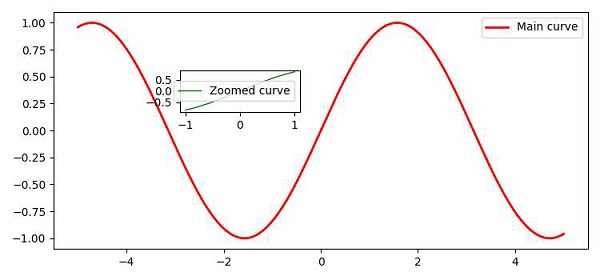
How to zoom a portion of an image and insert in the same plot in Matplotlib?
To zoom a portion of an image and insert in the same plot, we can take the following steps −
Create x and y points, using numpy.
To zoom a part of an image, we can make data for x and y points, in that range.
Plot x and y points (Step 1), using the plot() method with lw=2, color red and label.
Use the legend() method to place text for the plot, Main curve.
Create the axes using the axes() method by putting the rectangle’s coordinate.
Plot x and y points (Step 2), using the plot() method with lw=1, color='green' and label, i.e., subpart of the plot.
Use the legend() method to place text for the plot, zoomed curve.
To display the figure, use the show() method.
Example
import numpy as np
from matplotlib import pyplot as plt
plt.rcParams["figure.figsize"] = [7.50, 3.50]
plt.rcParams["figure.autolayout"] = True
x = np.linspace(-5, 5, 1000)
y = np.sin(x)
x_zoom = np.linspace(-1, 1, 50)
y_zoom = np.sin(x_zoom)
plt.plot(x, y, c='red', lw=2, label="Main curve")
plt.legend()
axes = plt.axes([.30, .6, .20, .15])
axes.plot(x_zoom, y_zoom, c='green', lw=1, label="Zoomed curve")
axes.legend()
plt.show()
Output

Updated on: 2021-04-09T13:08:33+05:30
4K+ Views

Advertisements