
Article Categories
- All Categories
-
 Data Structure
-
 Networking
-
 RDBMS
RDBMS
-
 Operating System
-
 Java
Java
-
 MS Excel
-
 iOS
iOS
-
 HTML
HTML
-
 CSS
CSS
-
 Android
-
 Python
-
 C Programming
-
 C++
C++
-
 C#
C#
-
 MongoDB
-
 MySQL
MySQL
-
 Javascript
-
 PHP
PHP
-
 Economics & Finance
Selected Reading
How to write the plot title in multiple lines using plot function in R?
Mostly, the main title of a plot is short but we might have a long line to write for the main title of the plot. For example, a short version might be “Scatterplot” and a longer version might be “Scatterplot between X and Y”. Therefore, in plot function of R we can use line breaks for the main title as "Scatterplot
between
X and Y".
Example
set.seed(123)
x <-rnorm(10)
y <-rnorm(10,2.5)
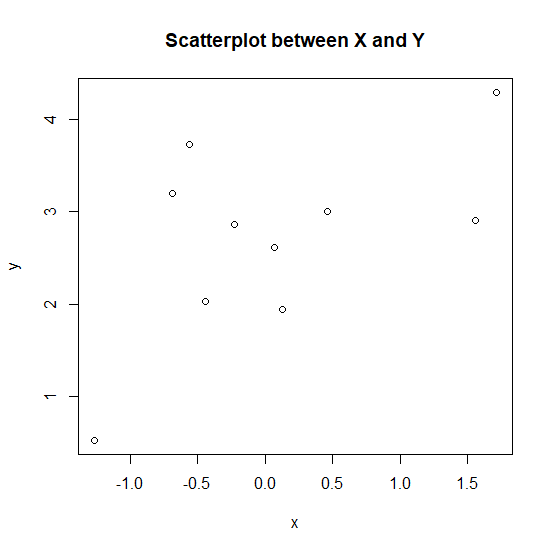
Creating a simple scatterplot between x and y with main title −
plot(x,y,main="Scatterplot between X and Y")
Output
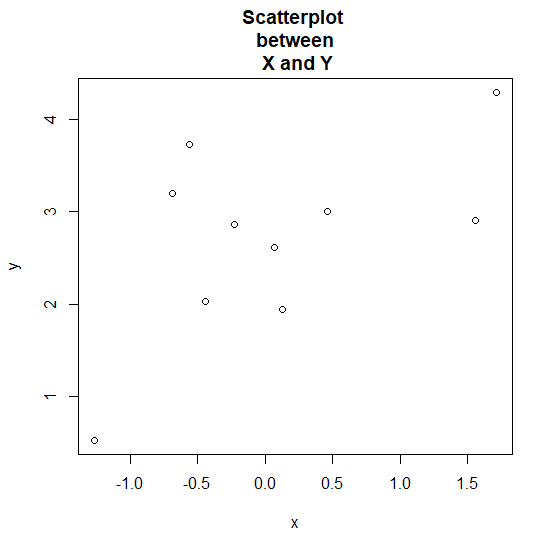
Creating a simple scatterplot between x and y with main title in multiple lines −
Output
plot(x,y,main="Scatterplot <br> between <br> X and Y")
Output

Updated on: 2020-08-24T12:34:17+05:30
2K+ Views

Advertisements