
Article Categories
- All Categories
-
 Data Structure
-
 Networking
-
 RDBMS
RDBMS
-
 Operating System
-
 Java
Java
-
 MS Excel
-
 iOS
iOS
-
 HTML
HTML
-
 CSS
CSS
-
 Android
-
 Python
-
 C Programming
-
 C++
C++
-
 C#
C#
-
 MongoDB
-
 MySQL
MySQL
-
 Javascript
-
 PHP
PHP
-
 Economics & Finance
How to update the plot title with Matplotlib using animation?
To update the plot title with Matplotlib using animation, you can dynamically change the title text during each animation frame. This is useful for displaying real-time information or creating interactive visualizations.
Basic Approach
The key steps for animating plot titles are ?
- Set the figure size and adjust the padding between and around the subplots
- Create a new figure using figure() method
- Create x and y data points using numpy
- Get the current axis and add initial plot elements
- Define an animate function that updates the title for each frame
- Use FuncAnimation() to create the animation
- Display the figure using show() method
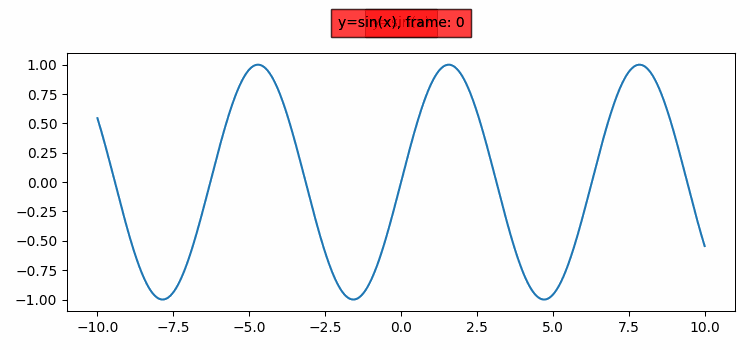
Example: Animated Title with Frame Counter
Here's how to create an animated sine wave plot with a title that updates to show the current frame number ?
import numpy as np
from matplotlib import pyplot as plt, animation

plt.rcParams["figure.figsize"] = [7.50, 3.50]
plt.rcParams["figure.autolayout"] = True

fig = plt.figure()

x = np.linspace(-10, 10, 1000)
y = np.sin(x)

plt.plot(x, y)

ax = plt.gca()
title_text = ax.text(0.5, 1.100, "y=sin(x)",
                     bbox={'facecolor': 'red', 'alpha': 0.5, 'pad': 5},
                     transform=ax.transAxes, ha="center")

def animate(frame):
    title_text.set_text(f"y=sin(x), frame: {frame}")

ani = animation.FuncAnimation(fig, animate, interval=100,
                              frames=10, repeat=True)

plt.show()
How It Works
The animation works by storing a reference to the title text object and updating its content in the animate() function. The set_text() method changes the displayed text without creating new text objects each frame, making the animation more efficient.
Advanced Example: Dynamic Data Visualization
You can also update titles based on changing data values ?
import numpy as np
from matplotlib import pyplot as plt, animation

fig, ax = plt.subplots(figsize=(8, 4))

x = np.linspace(0, 2*np.pi, 100)
line, = ax.plot(x, np.sin(x))

ax.set_xlim(0, 2*np.pi)
ax.set_ylim(-1.5, 1.5)

title_text = ax.set_title("Sine Wave - Phase: 0.0")

def animate(frame):
    phase = frame * 0.1
    y_data = np.sin(x + phase)
    line.set_ydata(y_data)
    title_text.set_text(f"Sine Wave - Phase: {phase:.1f}")
    return line, title_text

ani = animation.FuncAnimation(fig, animate, frames=63,
                              interval=50, blit=True, repeat=True)

plt.show()
Key Points
- Store references to text objects to update them efficiently
- Use
set_text()method to change title content - Format strings with f-strings for clean, readable code
- Set appropriate
intervalandframesparameters for smooth animation - Use
blit=Truefor better performance with complex animations
Output
Conclusion
Animating plot titles in Matplotlib enhances data visualization by providing dynamic context. Use set_text() to efficiently update titles and FuncAnimation() to create smooth, interactive plots.

3K+ Views
