
Article Categories
- All Categories
-
 Data Structure
-
 Networking
-
 RDBMS
RDBMS
-
 Operating System
-
 Java
Java
-
 MS Excel
-
 iOS
iOS
-
 HTML
HTML
-
 CSS
CSS
-
 Android
-
 Python
-
 C Programming
-
 C++
C++
-
 C#
C#
-
 MongoDB
-
 MySQL
MySQL
-
 Javascript
-
 PHP
PHP
-
 Economics & Finance
Selected Reading
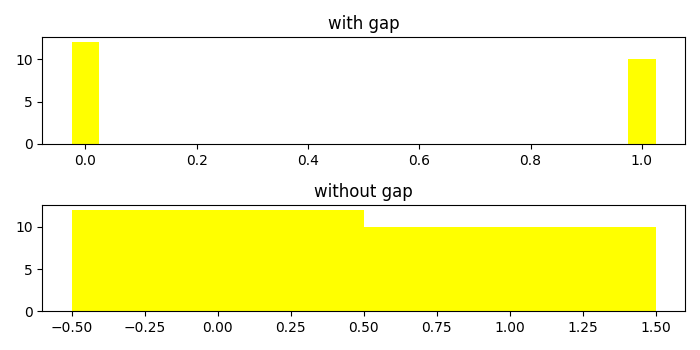
How to remove gaps between bars in Matplotlib bar chart?
To remove gaps between bars, we can change the align value to center in the argument of bar() method.
Steps
Create a dictionary called data with two keys, milk and water.
Get the list of keys and values in the dictionay.
Using subplots() method, create a figure and add a set of two subplots.
On axis 2, use bar method to plot bars without gaps. Set the width attribute as 1.0. Set the title using set_title() method.
Use tight_layout() to adjust the padding between and around the subplots.
To display the figure, use show() method.
Example
import matplotlib.pyplot as plt
plt.rcParams["figure.figsize"] = [7.00, 3.50]
plt.rcParams["figure.autolayout"] = True
data = {'milk': 12, 'water': 10}
names = list(data.keys())
values = list(data.values())
fif, (ax1, ax2) = plt.subplots(2)
ax1.bar(range(len(data)), values, align='center', width=.05, color='yellow')
ax1.set_title("with gap")
ax2.bar(range(len(data)), values, align='edge', width=1.0, color='yellow')
ax2.set_title("without gap")
plt.tight_layout()
plt.show()
Output

Updated on: 2021-05-08T09:47:45+05:30
10K+ Views

Advertisements