
Article Categories
- All Categories
-
 Data Structure
-
 Networking
-
 RDBMS
RDBMS
-
 Operating System
-
 Java
Java
-
 MS Excel
-
 iOS
iOS
-
 HTML
HTML
-
 CSS
CSS
-
 Android
-
 Python
-
 C Programming
-
 C++
C++
-
 C#
C#
-
 MongoDB
-
 MySQL
MySQL
-
 Javascript
-
 PHP
PHP
-
 Economics & Finance
Selected Reading
How to put labels on a scatterplot that is created plot function in R?
Labelling of points on a scatterplot helps us to identify the pair of observations. For example, if we are plotting weight and height of people then we can label it with person’s name, therefore, we will be able to understand which pair of points belong to which person. This can be done by using text function after creating the scatterplot with plot function.
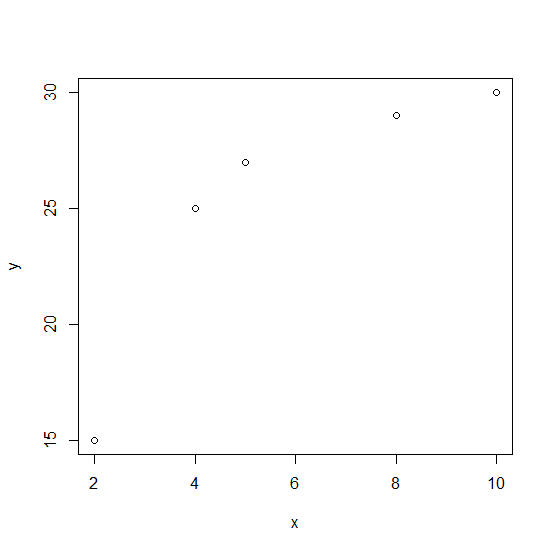
Example
x <-c(2,4,5,8,10)
y <-c(15,25,27,29,30)
plot(x,y)
Output
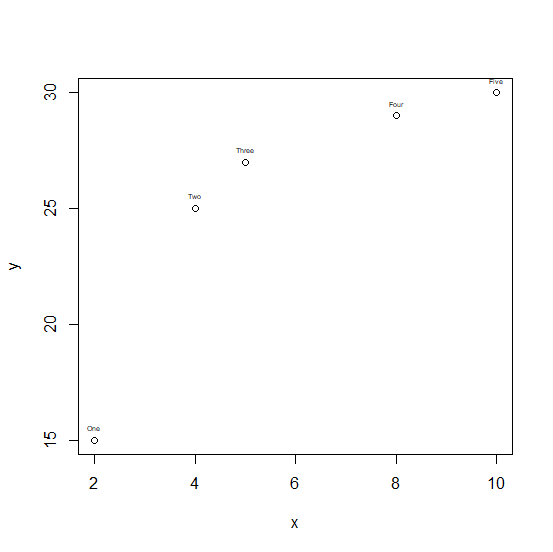
Now suppose we have labels and want to add them on the above plot then it can be done as follows −
Labels <-c("One","Two","Three","Four","Five")
text(x,y,labels=Labels,cex=0.4,pos=3)
Output

Updated on: 2020-08-21T12:25:19+05:30
282 Views

Advertisements