
Article Categories
- All Categories
-
 Data Structure
-
 Networking
-
 RDBMS
RDBMS
-
 Operating System
-
 Java
Java
-
 MS Excel
-
 iOS
iOS
-
 HTML
HTML
-
 CSS
CSS
-
 Android
-
 Python
-
 C Programming
-
 C++
C++
-
 C#
C#
-
 MongoDB
-
 MySQL
MySQL
-
 Javascript
-
 PHP
PHP
-
 Economics & Finance
Selected Reading
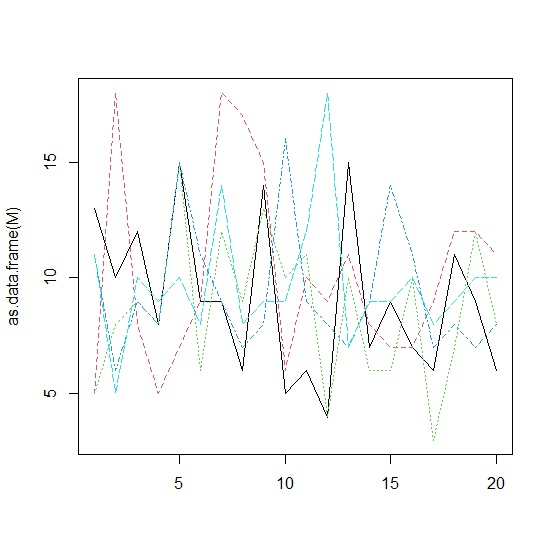
How to plot matrix columns as lines in base R?
To plot matrix columns as lines in base R, we can use matplot function but we need to read the matrix as a data frame using as.data.frame function and for creating lines the type argument will be used. For example, if we have a matrix called M then the columns of M can be plotted as lines using the command matplot(as.data.frame(M),type="l").
Consider the below data frame −
Example
M<-matrix(rpois(100,10),nrow=20)
M
Output
    [,1] [,2] [,3] [,4] [,5]
[1,] 13    5    5   11   11
[2,] 10   18    8    6    5
[3,] 12    8    9    9   10
[4,]  8    5    8    8    9
[5,] 15    7   15   15   10
[6,]  9    9    6   11    8
[7,]  9   18   12    9   14
[8,]  6   17    9    7    8
[9,] 14   15   13    8    9
[10,] 5    6   10   16    9
[11,] 6   10   11    9   12
[12,] 4    9    4    8   18
[13,] 15  11   10    7    7
[14,]  7   8    6    9    9
[15,]  9   7    6   14    9
[16,]  7   7   10   11   10
[17,]  6   9    3    7    8
[18,] 11  12    7    8    9
[19,]  9  12   12    7   10
[20,]  6  11    8    8   10
Creating a plot of columns of matrix M with lines −
Example
matplot(as.data.frame(M),type="l")
Output

Updated on: 2026-03-11T22:50:55+05:30
2K+ Views

Advertisements