
Article Categories
- All Categories
-
 Data Structure
-
 Networking
-
 RDBMS
RDBMS
-
 Operating System
-
 Java
Java
-
 MS Excel
-
 iOS
iOS
-
 HTML
HTML
-
 CSS
CSS
-
 Android
-
 Python
-
 C Programming
-
 C++
C++
-
 C#
C#
-
 MongoDB
-
 MySQL
MySQL
-
 Javascript
-
 PHP
PHP
-
 Economics & Finance
Selected Reading
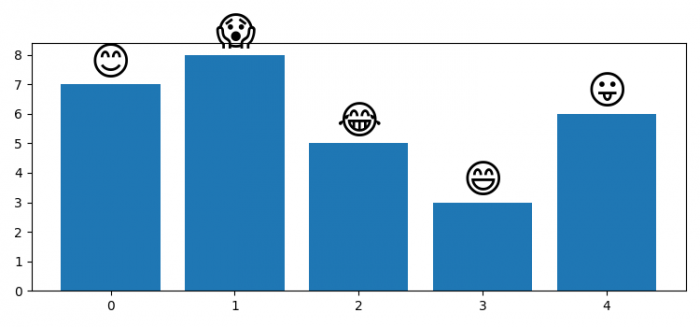
How to plot an emoji as a label for a bar in Matplotlib?
We can use Matplotlib's annotate() method to place emojis as labels on top of bars. This creates visually appealing charts that combine data visualization with expressive emoji symbols.
Steps
- Set the figure size and adjust the padding between and around the subplots
- Create lists of frequencies and labels containing emojis
- Create a new figure using figure() method
- Plot bars using bar() method
- Use annotate() method to place emojis as labels above each bar
- Display the figure using show() method
Example
Here's how to create a bar chart with emoji labels ?
import numpy as np
import matplotlib.pyplot as plt

plt.rcParams["figure.figsize"] = [7.50, 3.50]
plt.rcParams["figure.autolayout"] = True

freqs = [7, 8, 5, 3, 6]
labels = ['?', '?', '?', '?', '?']

plt.figure()
bars = plt.bar(np.arange(len(labels)), freqs)

for bar, label in zip(bars, labels):
    height = bar.get_height()
    plt.annotate(
        label,
        (bar.get_x() + bar.get_width()/2, height + 0.05),
        ha="center",
        va="bottom",
        fontsize=30
    )

plt.show()
How It Works
The code works by iterating through each bar and its corresponding emoji label. The annotate() method positions each emoji at the center of the bar's top edge using coordinates calculated from the bar's position and height.
Key Parameters
- ha="center" − Horizontal alignment centers the emoji
- va="bottom" − Vertical alignment places emoji above the bar
- fontsize=30 − Makes emojis large enough to be clearly visible
- height + 0.05 − Adds small padding above each bar
Output
Conclusion
Using annotate() with emoji labels makes bar charts more engaging and intuitive. Adjust the fontsize and positioning offset to match your specific design requirements.

Updated on: 2026-03-25T21:16:17+05:30
2K+ Views

Advertisements