
Article Categories
- All Categories
-
 Data Structure
-
 Networking
-
 RDBMS
RDBMS
-
 Operating System
-
 Java
Java
-
 MS Excel
-
 iOS
iOS
-
 HTML
HTML
-
 CSS
CSS
-
 Android
-
 Python
-
 C Programming
-
 C++
C++
-
 C#
C#
-
 MongoDB
-
 MySQL
MySQL
-
 Javascript
-
 PHP
PHP
-
 Economics & Finance
Selected Reading
How to include a zero with tick in base R plot?
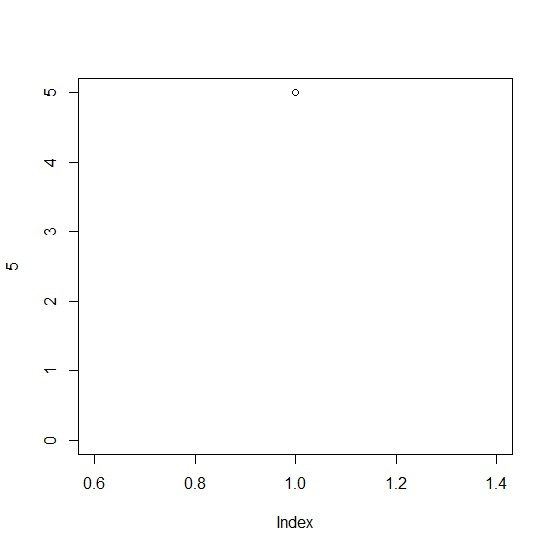
When we create a plot in base R the Y-axis values are generated automatically and mostly zero is now shown except in few cases that can’t be defined in particular but happens when there exists a zero in data. Therefore, if we want to include a zero with tick in base R plot then ylim argument can be used with the plot function.
Example
plot(5,ylim=c(0,5))
Output
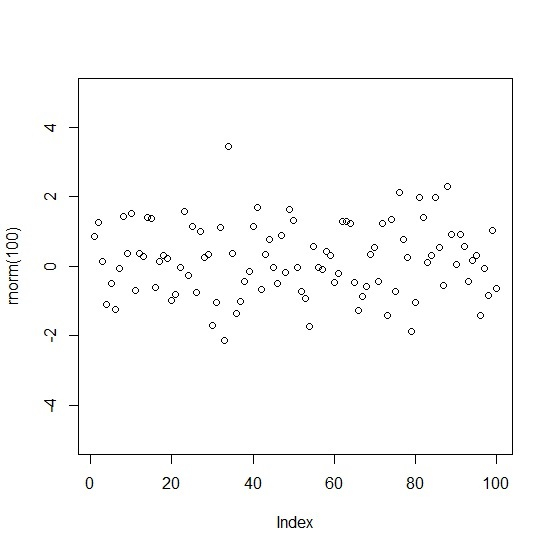
Example
plot(rnorm(100),ylim=c(-5,5))
Output
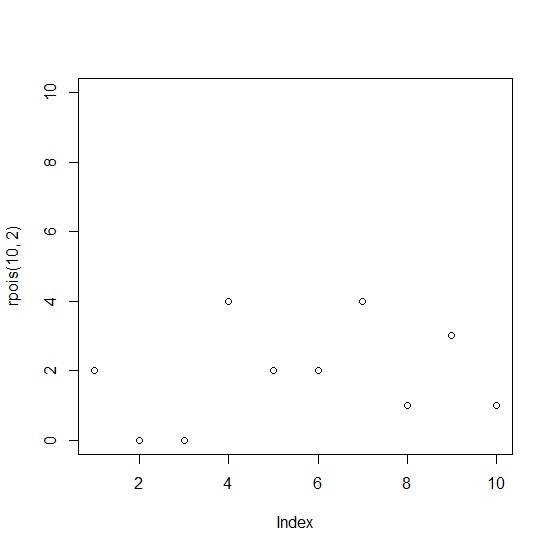
Example
plot(rpois(10,2),ylim=c(0,10))
Output

Updated on: 2021-02-06T08:04:09+05:30
439 Views

Advertisements