
Article Categories
- All Categories
-
 Data Structure
-
 Networking
-
 RDBMS
RDBMS
-
 Operating System
-
 Java
Java
-
 MS Excel
-
 iOS
iOS
-
 HTML
HTML
-
 CSS
CSS
-
 Android
-
 Python
-
 C Programming
-
 C++
C++
-
 C#
C#
-
 MongoDB
-
 MySQL
MySQL
-
 Javascript
-
 PHP
PHP
-
 Economics & Finance
Selected Reading
How to highlight a value with underline in base R plot?
To highlight a value with underline in base R plot, we can use underline function within text function. The text function will be used to define the value that we need to underline in the plot and underline function will only underline that part.
Check out the below given example to understand how it works.
Example
To highlight a value with underline in base R plot, use the code given below −
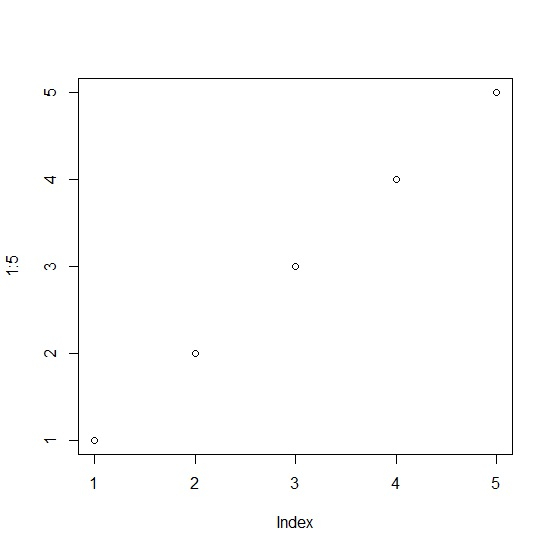
plot(1:5)
Output
If you execute the above given code, it generates the following output −
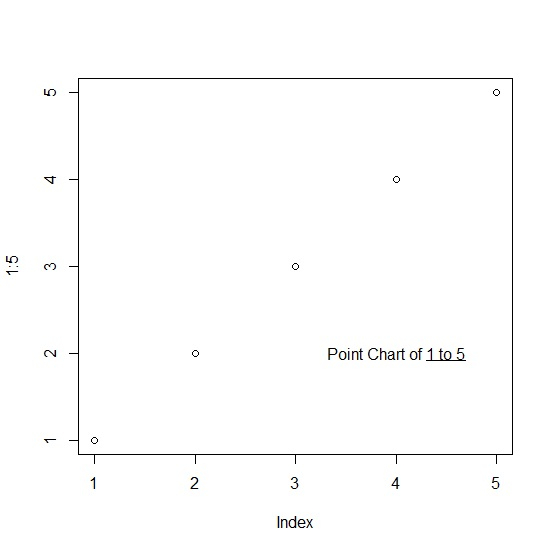
To highlight a value with underline in base R plot, add the following code to the above code −
plot(1:5)
text(4,2,bquote("Point Chart of"~underline("1 to 5")))
Output
If you execute all the above given codes as a single program, it generates the following output −

Updated on: 2021-11-12T08:24:01+05:30
980 Views

Advertisements