
Article Categories
- All Categories
-
 Data Structure
-
 Networking
-
 RDBMS
RDBMS
-
 Operating System
-
 Java
Java
-
 MS Excel
-
 iOS
iOS
-
 HTML
HTML
-
 CSS
CSS
-
 Android
-
 Python
-
 C Programming
-
 C++
C++
-
 C#
C#
-
 MongoDB
-
 MySQL
MySQL
-
 Javascript
-
 PHP
PHP
-
 Economics & Finance
Selected Reading
How to highlight a bar in base R histogram?
To highlight a bar in base R histogram, we need to understand the X-axis values and pass the col argument inside hist function appropriately. We just need to put a separate value for the bar that we want to highlight and set the colouring of the rest of the bars to 0 (that is default in base R). Check out the below examples to understand how it works.
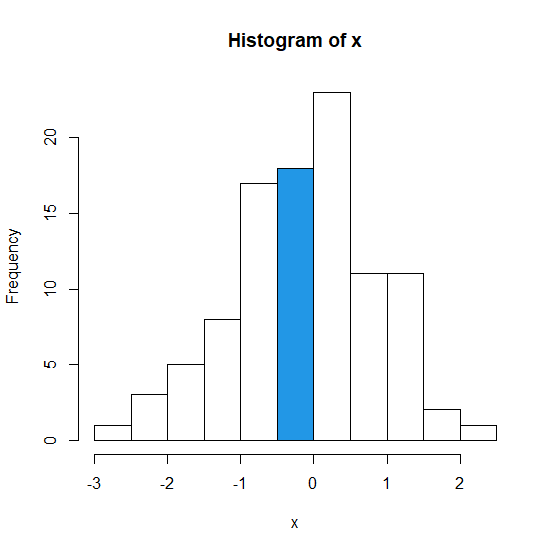
Example1
> x<-rnorm(100)
> hist(x,col = c(rep(0,5),4,rep(0,5)))
Output
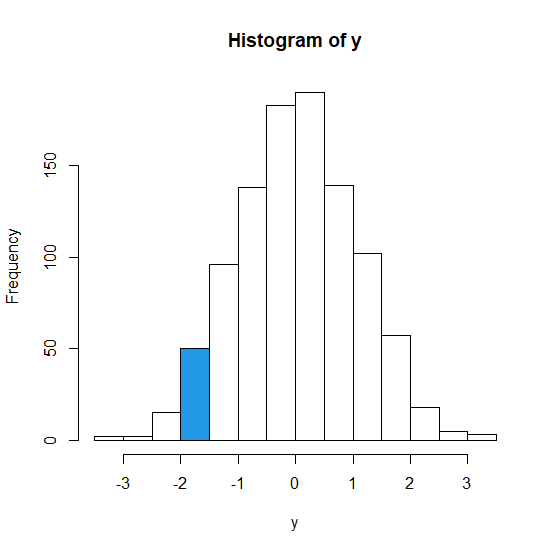
Example2
> y<-rnorm(1000)
> hist(y,col = c(rep(0,3),4,rep(0,9)))
Output

Updated on: 2021-03-04T08:41:48+05:30
679 Views

Advertisements