
Article Categories
- All Categories
-
 Data Structure
-
 Networking
-
 RDBMS
RDBMS
-
 Operating System
-
 Java
Java
-
 MS Excel
-
 iOS
iOS
-
 HTML
HTML
-
 CSS
CSS
-
 Android
-
 Python
-
 C Programming
-
 C++
C++
-
 C#
C#
-
 MongoDB
-
 MySQL
MySQL
-
 Javascript
-
 PHP
PHP
-
 Economics & Finance
Selected Reading
How to fix the lower value for X-axis in base R
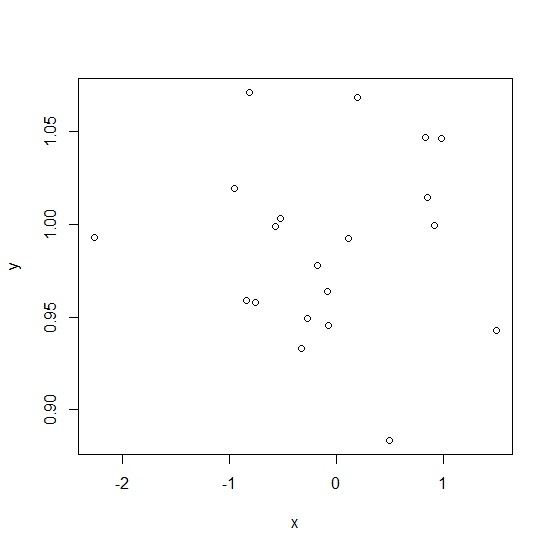
To fix the lower value for X-axis in base R, we can use xlim argument in plot function. Mostly, we set the lower value to zero but it is not necessary it can be something else, either less than zero or greater than zero as well. If only lower value needs to be fixed then upper value will be set by using the max function as shown in the below example.
Example
x<-rnorm(20)
y<-rnorm(20,1,0.04)
plot(x,y)
Output
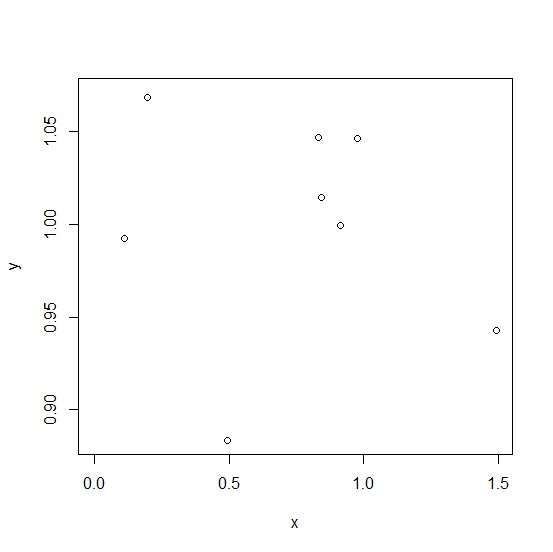
Example
plot(x,y,xlim=c(0,max(x)))
Output

Updated on: 2021-02-10T05:51:47+05:30
485 Views

Advertisements