
Article Categories
- All Categories
-
 Data Structure
-
 Networking
-
 RDBMS
RDBMS
-
 Operating System
-
 Java
Java
-
 MS Excel
-
 iOS
iOS
-
 HTML
HTML
-
 CSS
CSS
-
 Android
-
 Python
-
 C Programming
-
 C++
C++
-
 C#
C#
-
 MongoDB
-
 MySQL
MySQL
-
 Javascript
-
 PHP
PHP
-
 Economics & Finance
Selected Reading
How to draw a circle in R?
There is no direct function in R to draw a circle but we can make use of plotrix package for this purpose. The plotrix package has a function called draw.cirlce which is can be used to draw a circle but we first need to draw a plot in base R then pass the correct arguments in draw.circle. The first and second arguments of draw.circle takes x and y coordinates, and the third one is for radius, hence these should be properly chosen based on the chart in base R.
Loading plotrix package:
> library(plotrix)
Creating different circles using draw.circle:
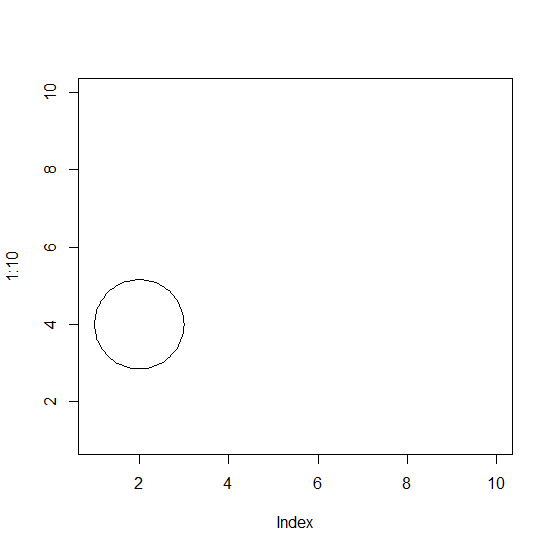
Example
> plot(1:10,type="n")
> draw.circle(2,4,1)
Output:
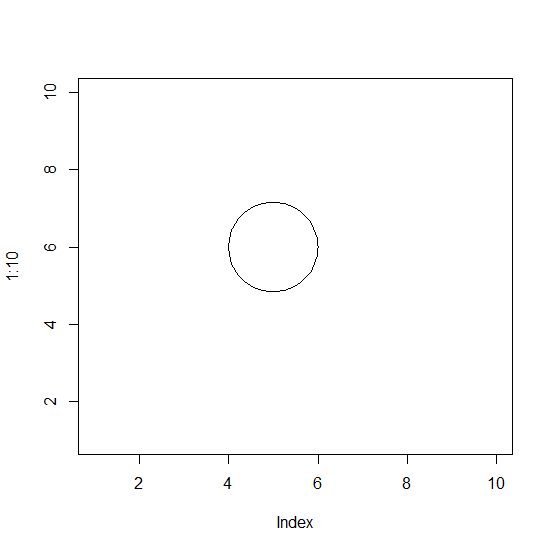
Example
> plot(1:10,type="n")
> draw.circle(5,6,1)
Output:

Updated on: 2026-03-11T22:50:53+05:30
4K+ Views

Advertisements