
Article Categories
- All Categories
-
 Data Structure
-
 Networking
-
 RDBMS
RDBMS
-
 Operating System
-
 Java
Java
-
 MS Excel
-
 iOS
iOS
-
 HTML
HTML
-
 CSS
CSS
-
 Android
-
 Python
-
 C Programming
-
 C++
C++
-
 C#
C#
-
 MongoDB
-
 MySQL
MySQL
-
 Javascript
-
 PHP
PHP
-
 Economics & Finance
How to display x-bar in base R plot?
To display x-bar in base R plot, we can use text function and define the bar with bar function inside expression function.
For example, if we have a vector called x that contains first ten numbers (1 to 10) then we can display it’s mean inside the base R plot by using the command given below −
text(0.97,5.5,expression(bar("x")))
Check out the examples given below to understand how it works.
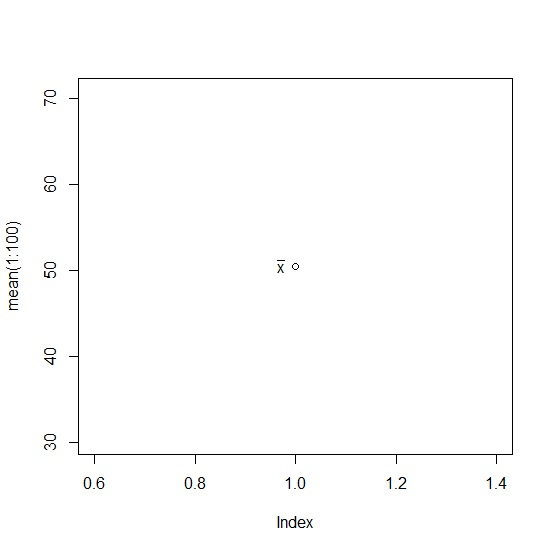
Example 1
Use the code given below to display x-bar in base R plot −
plot(mean(1:100))
text(0.97,50.5,expression(bar("x")))
Output
If you execute the above given snippet, it generates the following Output −
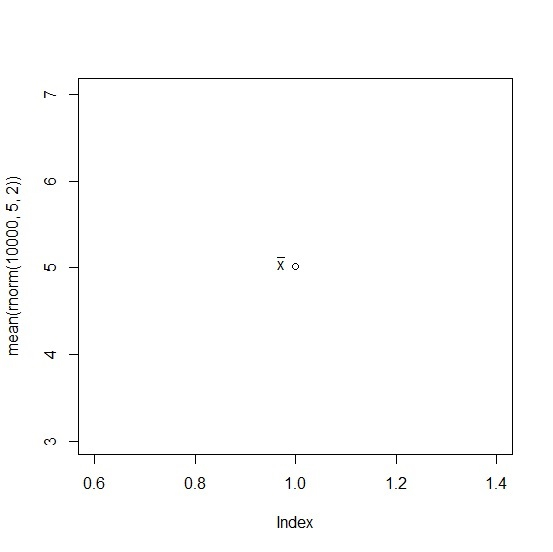
Example 2
Use the code given below to display x-bar in base R plot −
plot(mean(rnorm(10000,5,2)))
text(0.97,5.05,expression(bar("x")))
Output
If you execute the above given snippet, it generates the following Output −
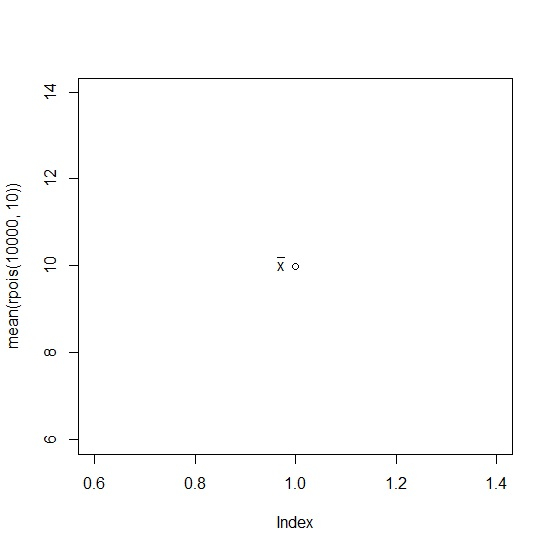
Example 3
Use the code given below to display x-bar in base R plot −
plot(mean(rpois(10000,10)))
text(0.97,10.05,expression(bar("x")))
Output
If you execute the above given snippet, it generates the following Output −

3K+ Views
