
Article Categories
- All Categories
-
 Data Structure
-
 Networking
-
 RDBMS
RDBMS
-
 Operating System
-
 Java
Java
-
 MS Excel
-
 iOS
iOS
-
 HTML
HTML
-
 CSS
CSS
-
 Android
-
 Python
-
 C Programming
-
 C++
C++
-
 C#
C#
-
 MongoDB
-
 MySQL
MySQL
-
 Javascript
-
 PHP
PHP
-
 Economics & Finance
How to display X-axis labels with dash in base R plot?
To display X-axis labels with dash in base R plot, we can use axis function and define the labels manually. For this purpose, we can first create the plot without X-axis labels by using the argument xaxt="n" and then use the axis function.
Check out the below example to understand how it can be done.
Example
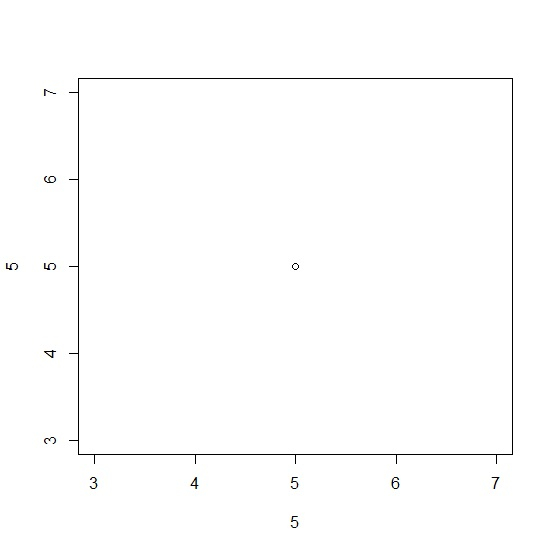
In order to display X-axis labels with dash in base R plot, use the following code −
plot(5,5)
Output
If you execute all the above given codes as a single program, it generates the following output −
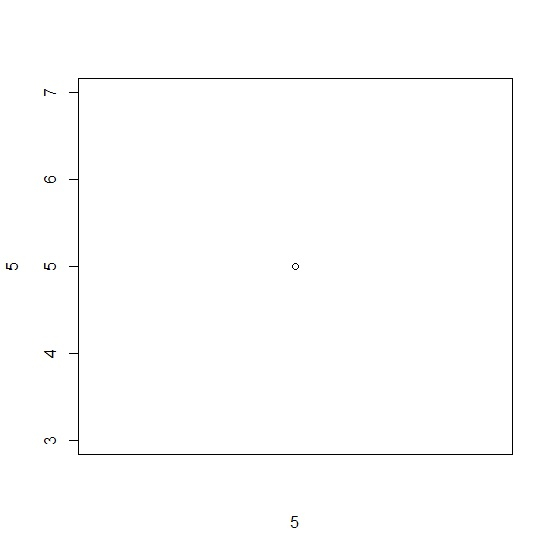
In order to display X-axis labels with dash in base R plot, add the following code to the above code −
plot(5,5,xaxt="n")
Output
If you execute all the above given codes as a single program, it generates the following output −
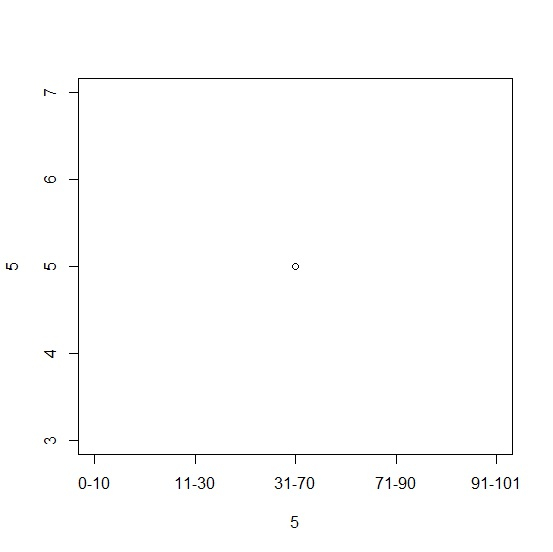
In order to display X-axis labels with dash in base R plot, add the following code to the above code −
plot(5,5,xaxt="n")
axis(1,at=c(3:7),labels=c("0-10","11-30","31-70","71-90","91-101"))
Output
If you execute all the above given codes as a single program, it generates the following output −

528 Views
