
Article Categories
- All Categories
-
 Data Structure
-
 Networking
-
 RDBMS
RDBMS
-
 Operating System
-
 Java
Java
-
 MS Excel
-
 iOS
iOS
-
 HTML
HTML
-
 CSS
CSS
-
 Android
-
 Python
-
 C Programming
-
 C++
C++
-
 C#
C#
-
 MongoDB
-
 MySQL
MySQL
-
 Javascript
-
 PHP
PHP
-
 Economics & Finance
Selected Reading
How to display upper and lower quartiles through different line in a boxplot in R?
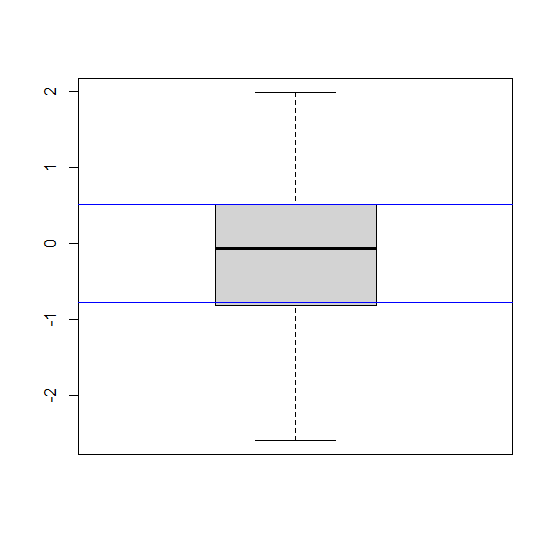
To display the upper and lower quartiles through different line in base R boxplot, we can use abline function but we need to find the quartiles inside abline using quantile for the respective quartiles. The lines created by using abline and quantiles and the boxplot function may not coincide because of the differences in calculation. The calculation method for boxplot is explained below −
The two ‘hinges’ are versions of the first and third quartile. The hinges equal the quartiles for odd n (where n
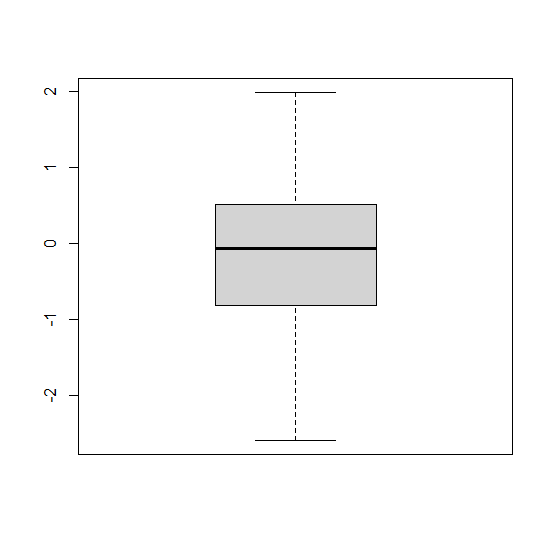
Example
> x<-rnorm(100)
> boxplot(x)
Output
Example
> abline(h=quantile(x,c(0.25,0.75)),col="blue")
Output

Updated on: 2021-03-04T07:52:21+05:30
266 Views

Advertisements