
Article Categories
- All Categories
-
 Data Structure
-
 Networking
-
 RDBMS
RDBMS
-
 Operating System
-
 Java
Java
-
 MS Excel
-
 iOS
iOS
-
 HTML
HTML
-
 CSS
CSS
-
 Android
-
 Python
-
 C Programming
-
 C++
C++
-
 C#
C#
-
 MongoDB
-
 MySQL
MySQL
-
 Javascript
-
 PHP
PHP
-
 Economics & Finance
Selected Reading
How to display the superscript for a single variable in a base R plot?
To display the superscript in a base R plot, we would need to use expression function inside text function. For example, if we want to display X-square inside a blank plot in base R then we can use the below code:
plot(1:10,type="n")
text(2,2,expression(X^2))
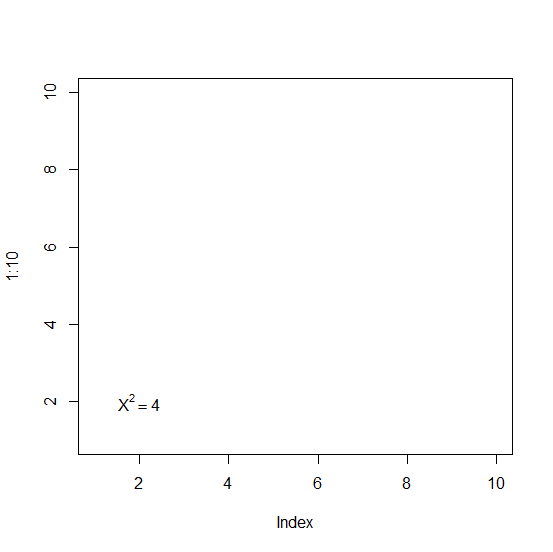
Example1
> plot(1:10,type="n")
> text(2,2,expression(X^2==4))
Output:
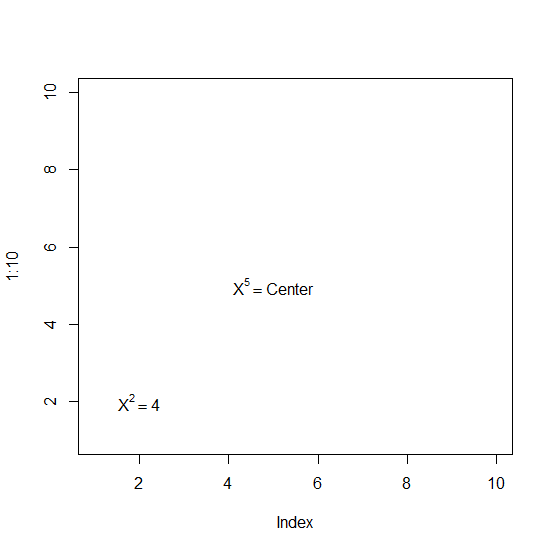
Example2
> text(5,5,expression(X^5==Center))
Output:
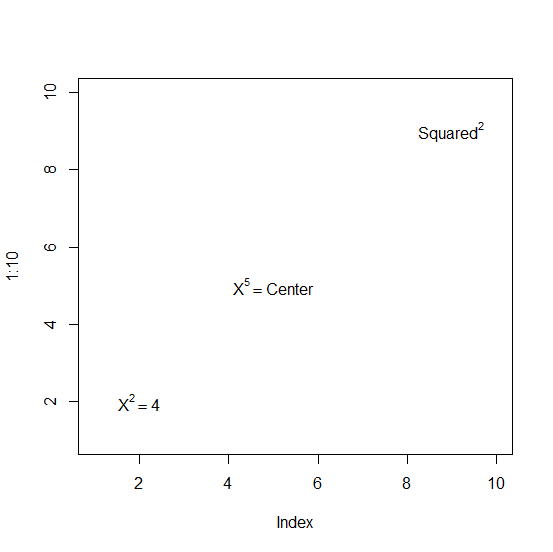
Example3
> text(9,9,expression(Squared^2))
Output:

Updated on: 2020-11-21T05:00:09+05:30
249 Views

Advertisements