
Article Categories
- All Categories
-
 Data Structure
-
 Networking
-
 RDBMS
RDBMS
-
 Operating System
-
 Java
Java
-
 MS Excel
-
 iOS
iOS
-
 HTML
HTML
-
 CSS
CSS
-
 Android
-
 Python
-
 C Programming
-
 C++
C++
-
 C#
C#
-
 MongoDB
-
 MySQL
MySQL
-
 Javascript
-
 PHP
PHP
-
 Economics & Finance
How to display text in base R plot with outline?
The display of text in base R plot with outline is not possible, for this purpose we would need to use shadowtext function of TeachingDemos package. The shadowtext function will be applied after creating the plot in base R.
We will have to provide the location of the text inside the plot and some other arguments such as text that needs to be displayed, color of outline, and size for better display.
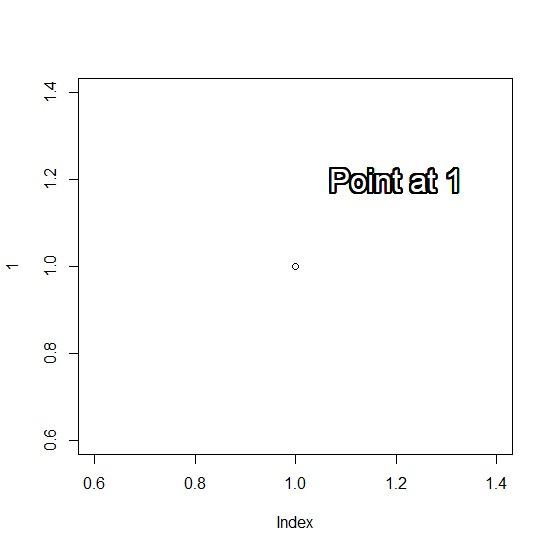
Example 1
Use the following code to display text in base R plot with outline −
plot(1)
shadowtext(1.2,1.2,"Point at 1",col="white",cex=2)
Output
If you execute the above given code, it generates the following Output −
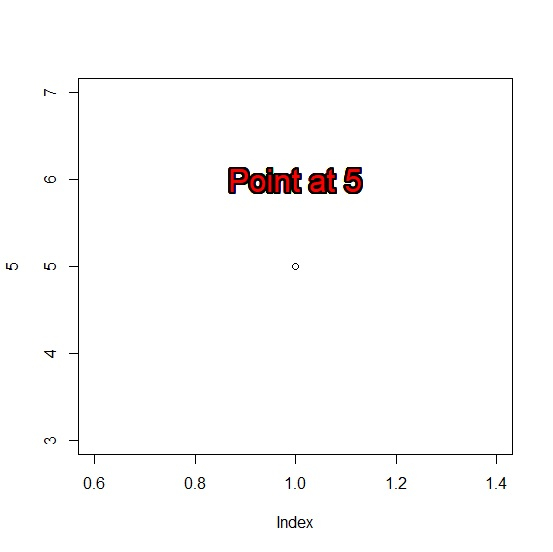
Example 2
Use the following code to display text in base R plot with outline −
plot(5)
shadowtext(1,6,"Point at 5",col="red",cex=2)
Output
If you execute the above given code, it generates the following
Output
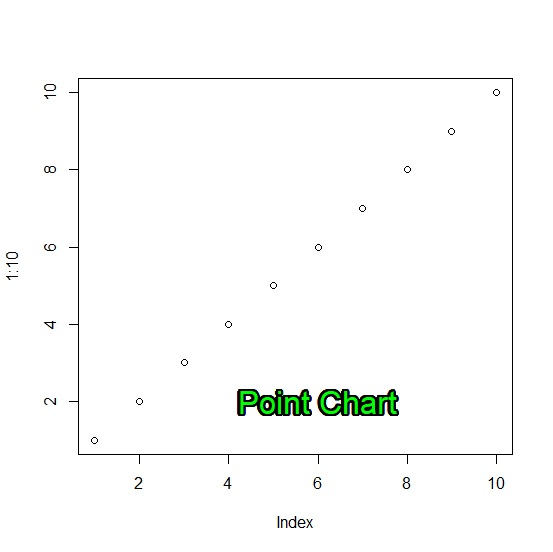
Example 3
Use the following code to display text in base R plot with outline −
plot(1:10)
shadowtext(6,2,"Point Chart",col="green",cex=2)
Output
If you execute the above given code, it generates the following Output −

543 Views
