
Article Categories
- All Categories
-
 Data Structure
-
 Networking
-
 RDBMS
RDBMS
-
 Operating System
-
 Java
Java
-
 MS Excel
-
 iOS
iOS
-
 HTML
HTML
-
 CSS
CSS
-
 Android
-
 Python
-
 C Programming
-
 C++
C++
-
 C#
C#
-
 MongoDB
-
 MySQL
MySQL
-
 Javascript
-
 PHP
PHP
-
 Economics & Finance
How to display superscript for X-axis title in base R plot?
To display superscript for X-axis title in base R plot, we can use ^ sign inside mtext function before defining the plain text.
For example, if we want to display X2 at position 5 on X-axis then it can be done by using the below command −
mtext(expression(paste(plain("X")^plain("2"))),side=1,line=2,at=5,cex=1.2)
Example
Consider the following snippet −
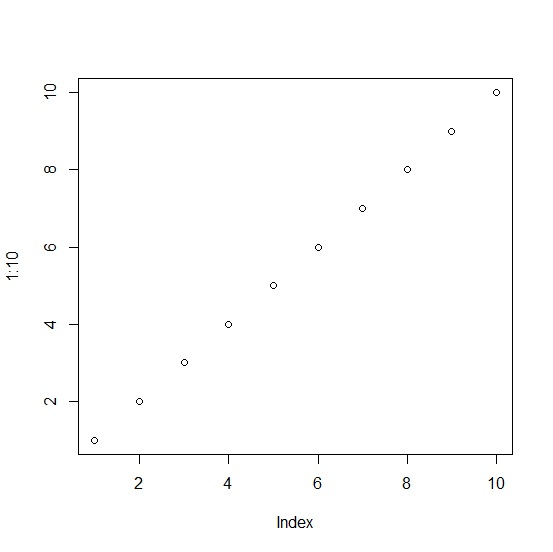
plot(1:10)
Output
If you execute the above given snippet, it generates the following Output −
To display superscript for X-axis title in base R plot, add the following code to the above snippet −
Example
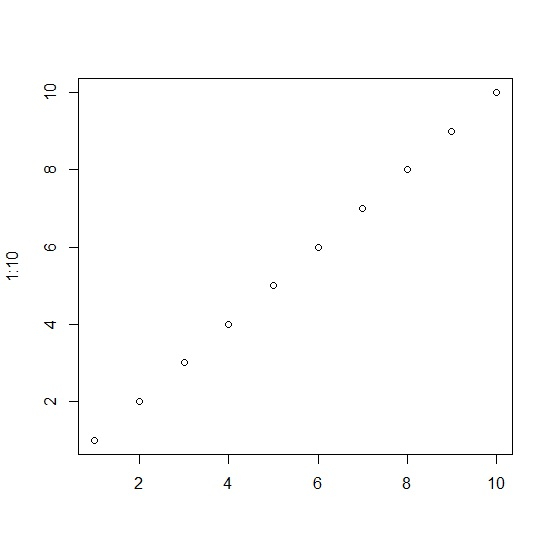
plot(1:10,xlab="")
Output
If you execute all the above given snippets as a single program, it generates the following Output −
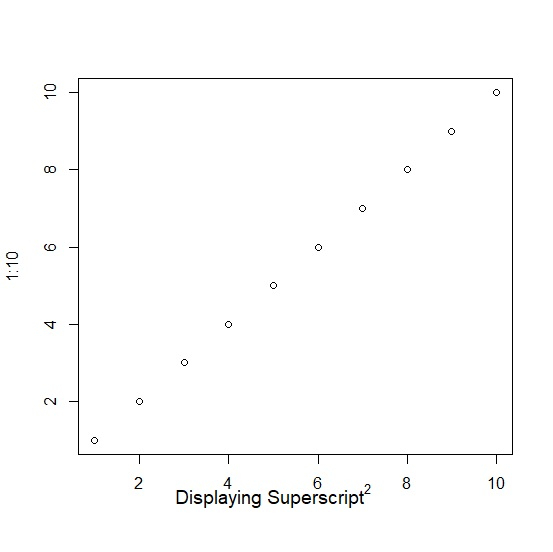
To display superscript for X-axis title in base R plot, add the following code to the above snippet −
Example
mtext(expression(paste(plain("Displaying Superscript")^plain("2"))),side=1,line=2,at=5,cex=1.2)
Output
If you execute all the above given snippets as a single program, it generates the following Output −

1K+ Views
