
Article Categories
- All Categories
-
 Data Structure
-
 Networking
-
 RDBMS
RDBMS
-
 Operating System
-
 Java
Java
-
 MS Excel
-
 iOS
iOS
-
 HTML
HTML
-
 CSS
CSS
-
 Android
-
 Python
-
 C Programming
-
 C++
C++
-
 C#
C#
-
 MongoDB
-
 MySQL
MySQL
-
 Javascript
-
 PHP
PHP
-
 Economics & Finance
Selected Reading
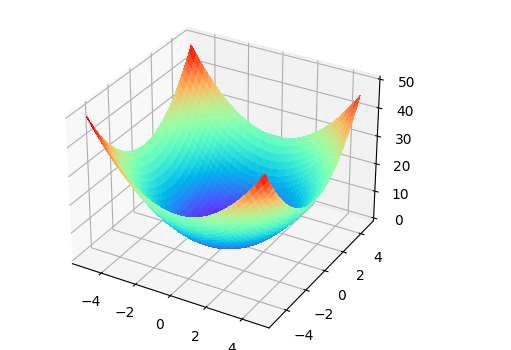
How to display a 3D plot of a 3D array isosurface in matplotlib mplot3D or similar?
Let's take an example to see how to display a 3D plot of a 3D array isosurface in matplotlib −
Example
import numpy as np
import matplotlib.pyplot as plt
from mpl_toolkits.mplot3d import Axes3D
plt.rcParams["figure.figsize"] = [7.50, 3.50]
plt.rcParams["figure.autolayout"] = True
x = np.arange(-5, 5, 0.25)
y = np.arange(-5, 5, 0.25)
x, y = np.meshgrid(x, y)
h = x ** 2 + y ** 2
fig = plt.figure()
ax = Axes3D(fig)
ax.plot_surface(x, y, h, rstride=1, cstride=1, cmap=plt.cm.rainbow, linewidth=0, antialiased=False)
plt.show()
Output

Updated on: 2021-04-10T07:31:20+05:30
1K+ Views

Advertisements