
Article Categories
- All Categories
-
 Data Structure
-
 Networking
-
 RDBMS
RDBMS
-
 Operating System
-
 Java
Java
-
 MS Excel
-
 iOS
iOS
-
 HTML
HTML
-
 CSS
CSS
-
 Android
-
 Python
-
 C Programming
-
 C++
C++
-
 C#
C#
-
 MongoDB
-
 MySQL
MySQL
-
 Javascript
-
 PHP
PHP
-
 Economics & Finance
Selected Reading
How to create two 3d plots at a time in R?
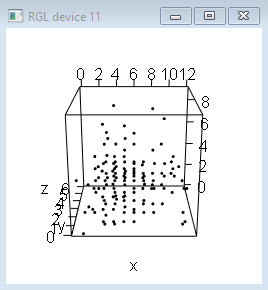
The rgl package is specifically designed to create real-time interactive 3D plots and we can create two 3d plots using plot3d function of this package. Also, these plots can be viewed in the R console at a single point of time with the help of open3d() function.
Example
Loading rgl package:
Example
> library(rgl)
> x<-rpois(200,5)
> y<-rpois(200,2)
> z<-rpois(200,3)
> plot3d(x,y,z)
Output
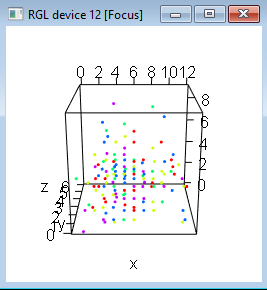
Example
> open3d()
wgl
12
> plot3d(x,y,z,col=rainbow(5))
Output

Updated on: 2020-11-21T05:13:06+05:30
344 Views

Advertisements