
Article Categories
- All Categories
-
 Data Structure
-
 Networking
-
 RDBMS
RDBMS
-
 Operating System
-
 Java
Java
-
 MS Excel
-
 iOS
iOS
-
 HTML
HTML
-
 CSS
CSS
-
 Android
-
 Python
-
 C Programming
-
 C++
C++
-
 C#
C#
-
 MongoDB
-
 MySQL
MySQL
-
 Javascript
-
 PHP
PHP
-
 Economics & Finance
How to create transparent boxplot in R?
Be default, the boxplot created in base R or by using ggplot2 are not transparent in nature. If we want to create a transparent boxplot then we can use bwplot function from lattice package.
For Example, if we have a vector called X then we can create transparent boxplot of X by using the below command −
bwplot(x)
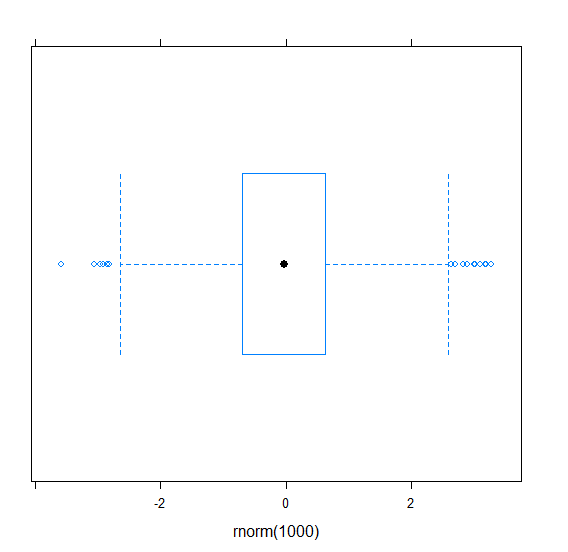
Example 1
To create transparent boxplot use the snippet given below −
library(lattice)
bwplot(rnorm(1000))
Output
If you execute the above given snippet, it generates the following Output −
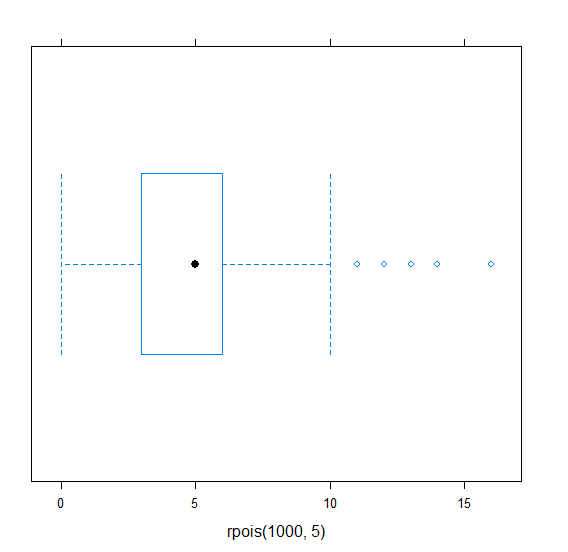
Example 2
To create transparent boxplot add the following code to the above snippet −
library(lattice)
bwplot(rpois(1000,5))
Output
If you execute all the above given snippets as a single program, it generates the following Output −
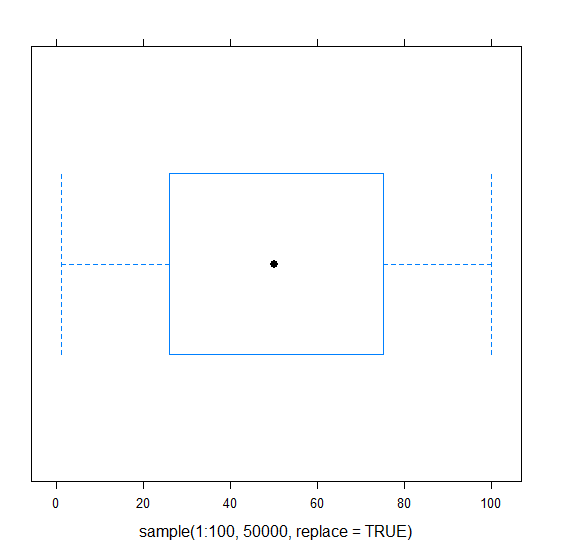
Example 3
To create transparent boxplot add the following code to the above snippet −
library(lattice)
bwplot(sample(1:100,50000,replace=TRUE))
Output
If you execute all the above given snippets as a single program, it generates the following Output −

1K+ Views
