
Article Categories
- All Categories
-
 Data Structure
-
 Networking
-
 RDBMS
RDBMS
-
 Operating System
-
 Java
Java
-
 MS Excel
-
 iOS
iOS
-
 HTML
HTML
-
 CSS
CSS
-
 Android
-
 Python
-
 C Programming
-
 C++
C++
-
 C#
C#
-
 MongoDB
-
 MySQL
MySQL
-
 Javascript
-
 PHP
PHP
-
 Economics & Finance
Selected Reading
How to create side by side histograms in base R?
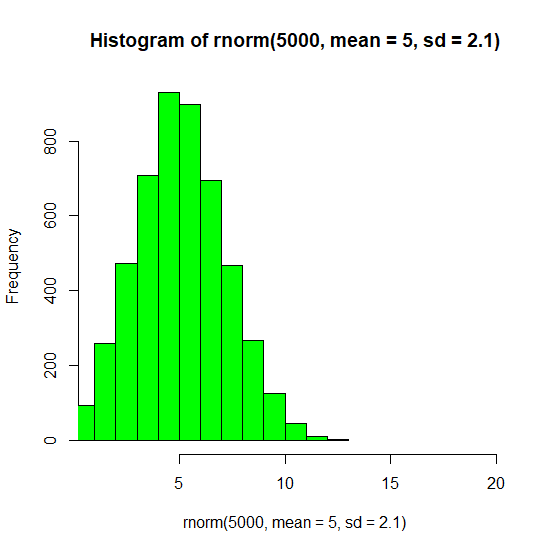
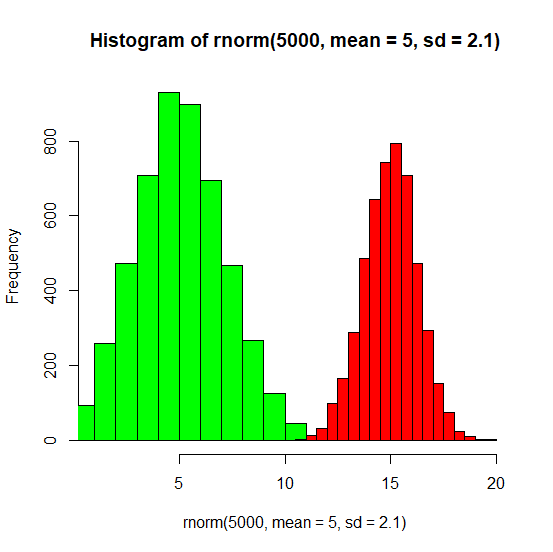
To create side by side histograms in base R, we first need to create a histogram using hist function by defining a larger limit of X-axis with xlim argument. After that we can create another histogram that has the larger mean and smaller standard deviation so that the bars do not clash with each other and add=T argument must also be added inside the second hist function.
Example
hist(rnorm(5000,mean=5,sd=2.1),col="green",xlim=c(1,20))
Output
Example
hist(rnorm(5000,mean=15,sd=1.25),col="red",add=T)
Output

Updated on: 2026-03-11T22:50:54+05:30
2K+ Views

Advertisements