
Article Categories
- All Categories
-
 Data Structure
-
 Networking
-
 RDBMS
RDBMS
-
 Operating System
-
 Java
Java
-
 MS Excel
-
 iOS
iOS
-
 HTML
HTML
-
 CSS
CSS
-
 Android
-
 Python
-
 C Programming
-
 C++
C++
-
 C#
C#
-
 MongoDB
-
 MySQL
MySQL
-
 Javascript
-
 PHP
PHP
-
 Economics & Finance
Selected Reading
How to create side-by-side boxplot in base R?
Often, we need to compare continuous variables using boxplots and thus side-by-side boxplots are required. Creating side-by-side boxplot in base R can be done with the help of creating space for graphs with the help of par(mfrow=). In this function, we can define the number of graphs and the sequence of these graphs, thus creation of side-by-side boxplot will become easy.
Consider the below vectors −
set.seed(100)
x<-rnorm(500,2,1)
y<-rnorm(500,2,0.5)
Define the range for Y-axis −
Y_range<-range(x,y)
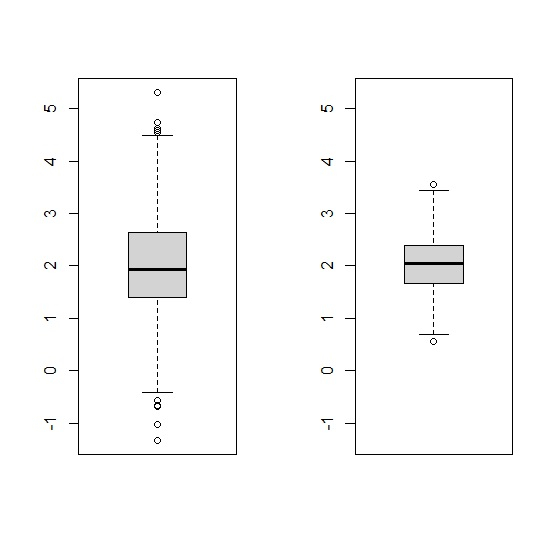
Creating graph space using par(mfrow=) −
par(mfrow=c(1,2))
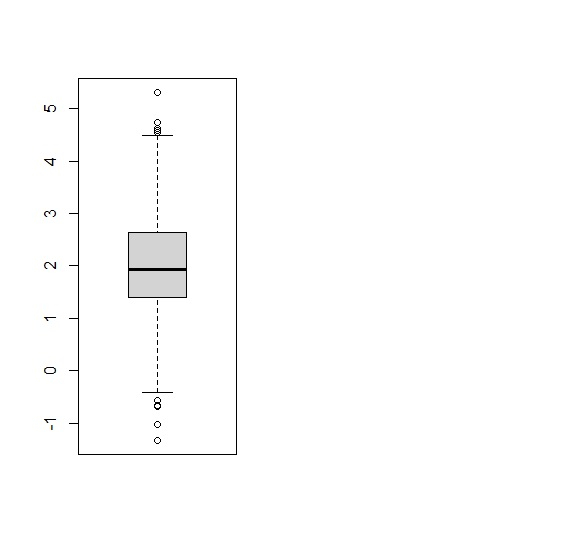
Creating first boxplot −
boxplot(x,ylim=Y_range)
This will create below output −
Creating second boxplot −
boxplot(y,ylim=Y_range)

Updated on: 2020-10-10T11:54:02+05:30
527 Views

Advertisements