
Article Categories
- All Categories
-
 Data Structure
-
 Networking
-
 RDBMS
RDBMS
-
 Operating System
-
 Java
Java
-
 MS Excel
-
 iOS
iOS
-
 HTML
HTML
-
 CSS
CSS
-
 Android
-
 Python
-
 C Programming
-
 C++
C++
-
 C#
C#
-
 MongoDB
-
 MySQL
MySQL
-
 Javascript
-
 PHP
PHP
-
 Economics & Finance
Selected Reading
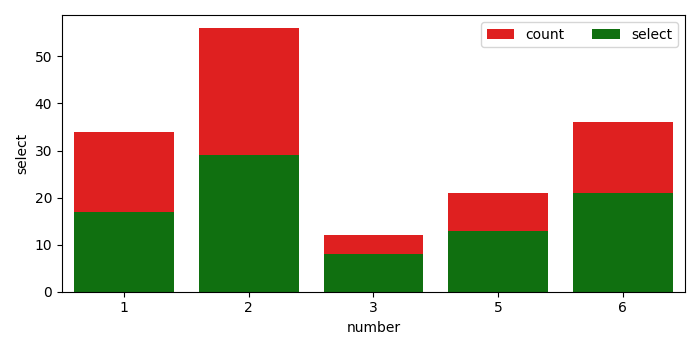
How to create a stacked bar chart for my DataFrame using Seaborn in Matplotlib?
To create a stacked bar chart, we can use Seaborn's barplot() method, i.e., show point estimates and confidence intervals with bars.
Create df using Pandas Data Frame.
Using barplot() method, create bar_plot1 and bar_plot2 with color as red and green, and label as count and select.
To enable legend, use legend() method, at the upper-right location.
To display the figuree, use show() method.
Example
import pandas
import matplotlib.pylab as plt
import seaborn as sns
plt.rcParams["figure.figsize"] = [7.00, 3.50]
plt.rcParams["figure.autolayout"] = True
df = pandas.DataFrame(dict(
   number=[2, 5, 1, 6, 3],
   count=[56, 21, 34, 36, 12],
   select=[29, 13, 17, 21, 8]
))
bar_plot1 = sns.barplot(x='number', y='count', data=df, label="count", color="red")
bar_plot2 = sns.barplot(x='number', y='select', data=df, label="select", color="green")
plt.legend(ncol=2, loc="upper right", frameon=True)
plt.show()
Output

Updated on: 2021-05-07T08:00:15+05:30
2K+ Views

Advertisements