
Article Categories
- All Categories
-
 Data Structure
-
 Networking
-
 RDBMS
RDBMS
-
 Operating System
-
 Java
Java
-
 MS Excel
-
 iOS
iOS
-
 HTML
HTML
-
 CSS
CSS
-
 Android
-
 Python
-
 C Programming
-
 C++
C++
-
 C#
C#
-
 MongoDB
-
 MySQL
MySQL
-
 Javascript
-
 PHP
PHP
-
 Economics & Finance
Selected Reading
How to create a plot with cross sign in R?
In base R, the plot with different shape of points can be created by using pch argument inside the plot function but if we want to use any sign that is not designed for pch argument by default then we should pass that particular sign. For example, if we want to use cross sign then we can use letter x with pch as pch = "x".
Example
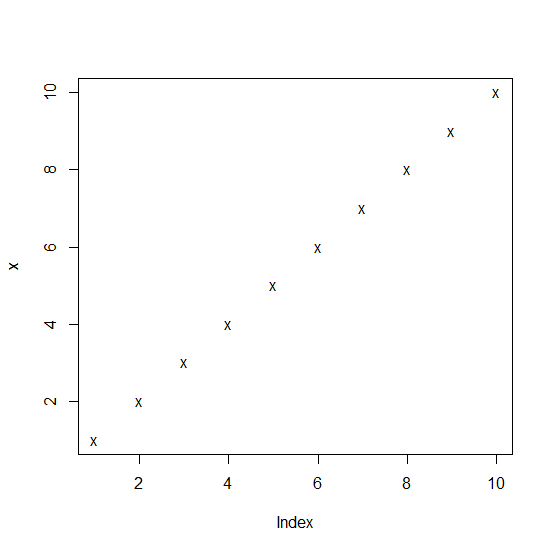
Consider the below vector and create the plot by displaying cross sign using letter x −
x<-1:10
plot(x,pch="x")
Output
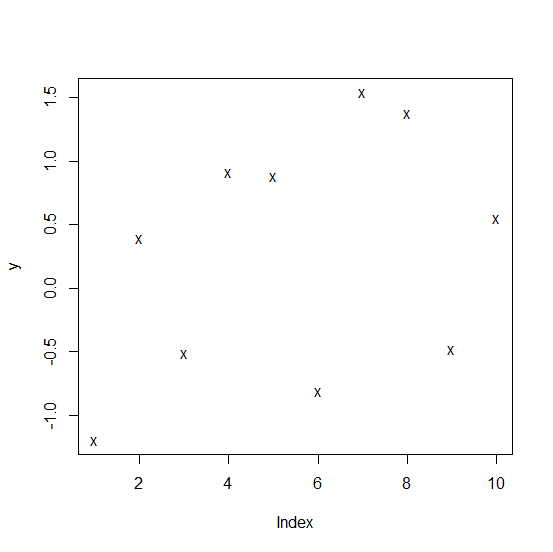
Example
y<-rnorm(10)
plot(y,pch="x")
Output
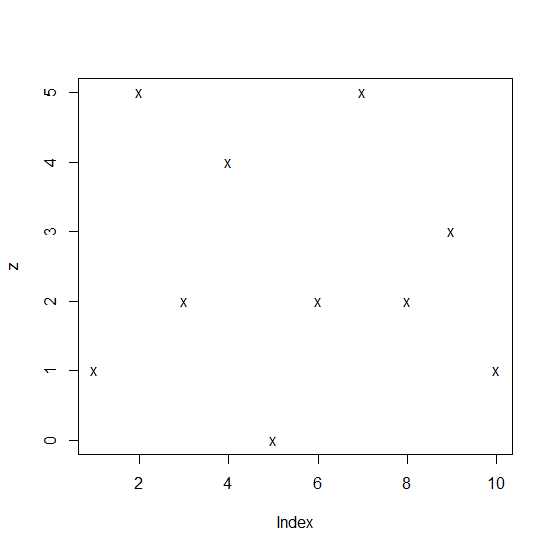
Example
z<-rpois(10,3)
plot(z,pch="x")
Output

Updated on: 2026-03-11T22:50:52+05:30
476 Views

Advertisements