
Article Categories
- All Categories
-
 Data Structure
-
 Networking
-
 RDBMS
RDBMS
-
 Operating System
-
 Java
Java
-
 MS Excel
-
 iOS
iOS
-
 HTML
HTML
-
 CSS
CSS
-
 Android
-
 Python
-
 C Programming
-
 C++
C++
-
 C#
C#
-
 MongoDB
-
 MySQL
MySQL
-
 Javascript
-
 PHP
PHP
-
 Economics & Finance
Selected Reading
How to create a line chart in R using plot function with larger width?
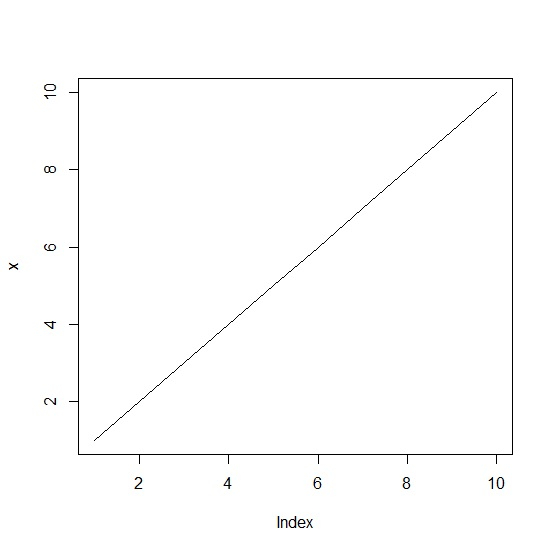
To create a line chart in base R using plot function, we need to use type = "l" so that R understand the plot needs to have a line instead of points. If we want to increase the width of the line then lwd argument can be used. The value lwd = 0 is the default value for the width.
Consider the below vector and create the line chart −
Example
x<-1:10
plot(x,type="l")
Output
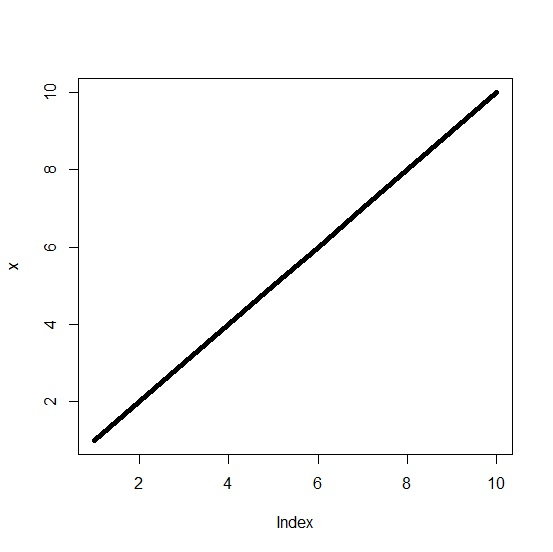
Create the line chart with larger width of the line −
Example
plot(x,type="l",lwd=5)
Output
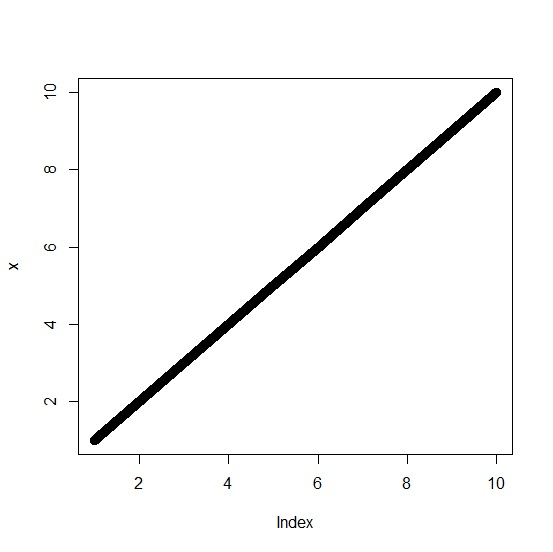
Create the line chart with very wide line −
Example
plot(x,type="l",lwd=10)
Output

Updated on: 2020-10-14T15:06:04+05:30
274 Views

Advertisements