
Article Categories
- All Categories
-
 Data Structure
-
 Networking
-
 RDBMS
RDBMS
-
 Operating System
-
 Java
Java
-
 MS Excel
-
 iOS
iOS
-
 HTML
HTML
-
 CSS
CSS
-
 Android
-
 Python
-
 C Programming
-
 C++
C++
-
 C#
C#
-
 MongoDB
-
 MySQL
MySQL
-
 Javascript
-
 PHP
PHP
-
 Economics & Finance
Selected Reading
How to create a horizontal boxplot in base R?
To create a horizontal boxplot in base R, we can set the horizontal argument inside boxplot function to TRUE. For example, if we have a vector called x then the horizontal histogram of that vector can be created by using the command boxplot(x,horizontal=TRUE).
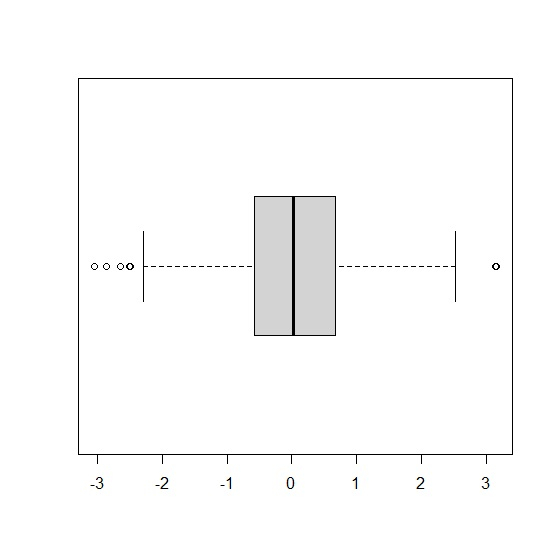
Example1
x<-rnorm(500)
boxplot(x,horizontal=TRUE)
Output
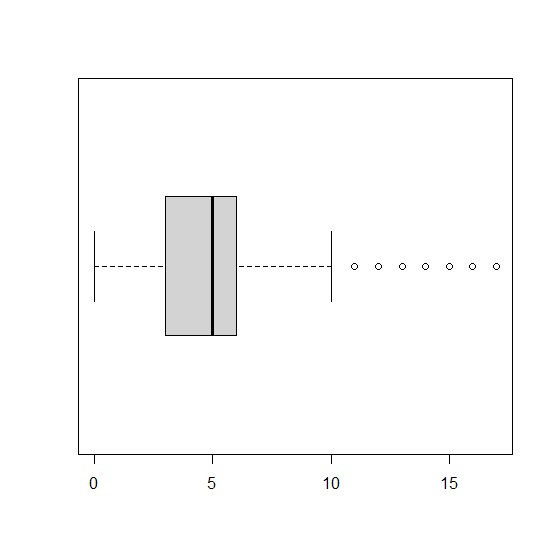
Example2
y<-rpois(10000,5)
boxplot(y,horizontal=TRUE)
Output
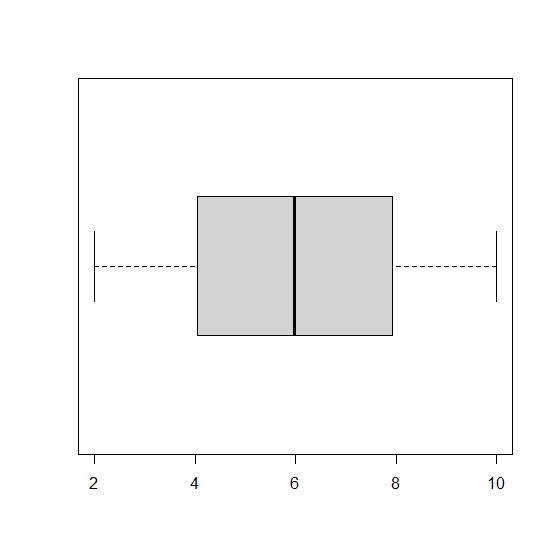
Example3
z<-runif(1000,2,10)
boxplot(z,horizontal=TRUE)
Output

Updated on: 2021-03-06T13:46:26+05:30
3K+ Views

Advertisements