
Article Categories
- All Categories
-
 Data Structure
-
 Networking
-
 RDBMS
RDBMS
-
 Operating System
-
 Java
Java
-
 MS Excel
-
 iOS
iOS
-
 HTML
HTML
-
 CSS
CSS
-
 Android
-
 Python
-
 C Programming
-
 C++
C++
-
 C#
C#
-
 MongoDB
-
 MySQL
MySQL
-
 Javascript
-
 PHP
PHP
-
 Economics & Finance
Selected Reading
How to create a frequency polygon in R?
Frequency polygons are the graphs of the values to understand the shape of the distribution of the values. They are useful in comparing different data sets and visualising cumulative frequency distribution of the data sets. In base R, we can use polygon function to create the frequency polygon but first we should create a line plot for the two variables under consideration.
Example
Consider the below vectors x and y −
set.seed(999)
x<-1:10
y<-sample(2:10,10,replace=TRUE)
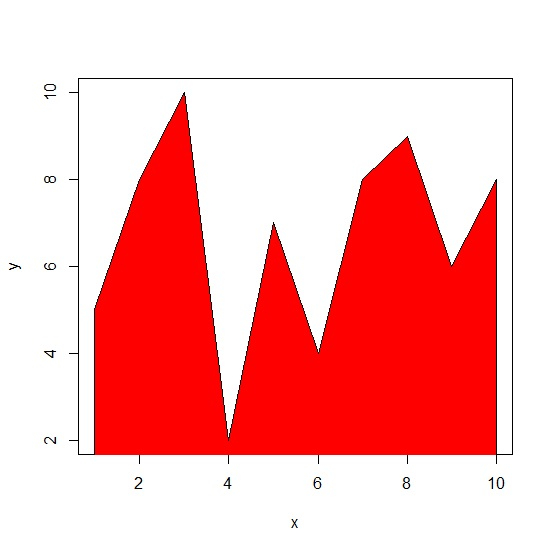
Creating the frequency polygon with red color −
plot(x,y,type="l") polygon(c(1,x,10),c(0,y,0),col="red")
Output
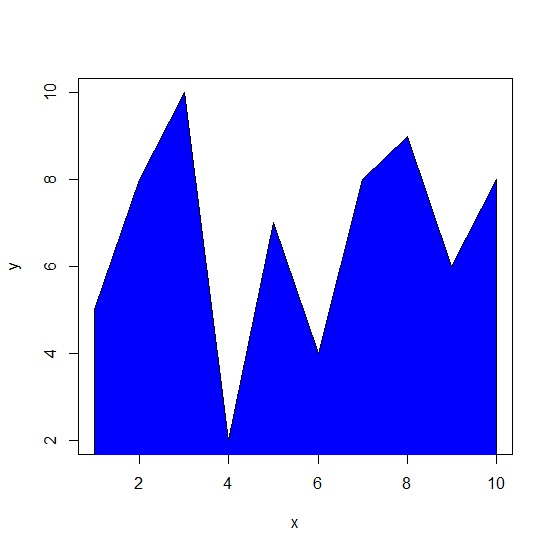
Creating the frequency polygon with blue color −
polygon(c(1,x,10),c(0,y,0),col="blue")
Output

Updated on: 2020-10-08T14:46:58+05:30
2K+ Views

Advertisements