
Article Categories
- All Categories
-
 Data Structure
-
 Networking
-
 RDBMS
RDBMS
-
 Operating System
-
 Java
Java
-
 MS Excel
-
 iOS
iOS
-
 HTML
HTML
-
 CSS
CSS
-
 Android
-
 Python
-
 C Programming
-
 C++
C++
-
 C#
C#
-
 MongoDB
-
 MySQL
MySQL
-
 Javascript
-
 PHP
PHP
-
 Economics & Finance
Selected Reading
How to create a cumulative sum plot in base R?
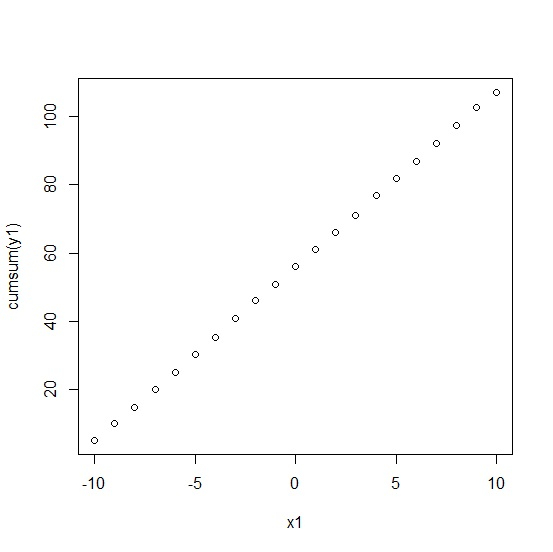
To create a cumulative sum plot in base R, we can simply use plot function. For cumulative sums inside the plot, the cumsum function needs to be used for the variable that has to be summed up with cumulation. For example, if we have two vectors say x and y then the plot with cumulative sum plot can be created as plot(x,cumsum(y)).
Example
x1<--10:10
y1<-rnorm(21,5,0.324)
plot(x1,cumsum(y1))
Output
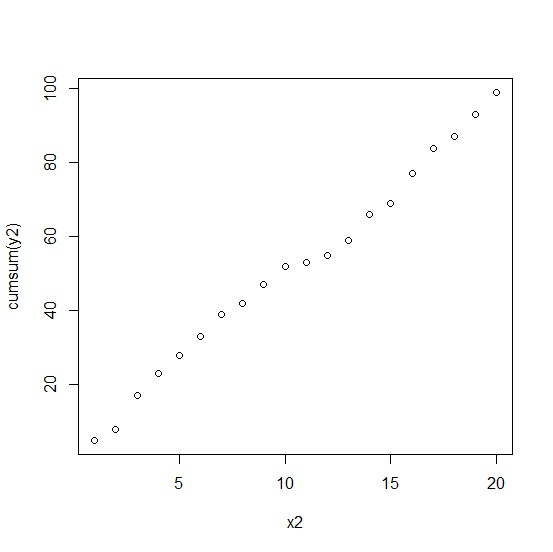
Example
x2<-1:20
y2<-rpois(20,5)
plot(x2,cumsum(y2))
Output

Updated on: 2021-02-08T05:11:00+05:30
4K+ Views

Advertisements