
Article Categories
- All Categories
-
 Data Structure
-
 Networking
-
 RDBMS
RDBMS
-
 Operating System
-
 Java
Java
-
 MS Excel
-
 iOS
iOS
-
 HTML
HTML
-
 CSS
CSS
-
 Android
-
 Python
-
 C Programming
-
 C++
C++
-
 C#
C#
-
 MongoDB
-
 MySQL
MySQL
-
 Javascript
-
 PHP
PHP
-
 Economics & Finance
Selected Reading
How to create a boxplot in base R without any axes except Y?
The boxplot function in base R helps us to create the boxplot without any hustle but this plot is covered with a square bracket and also takes the Y-axis labels on left-hand side. We can get rid of this square bracket without making an impact on the Y-axis labels. For this purpose, we need to use frame.plot = FALSE argument inside the boxplot function.
Example1
> x<-rnorm(1000)
> boxplot(x,frame.plot=FALSE)
Output:
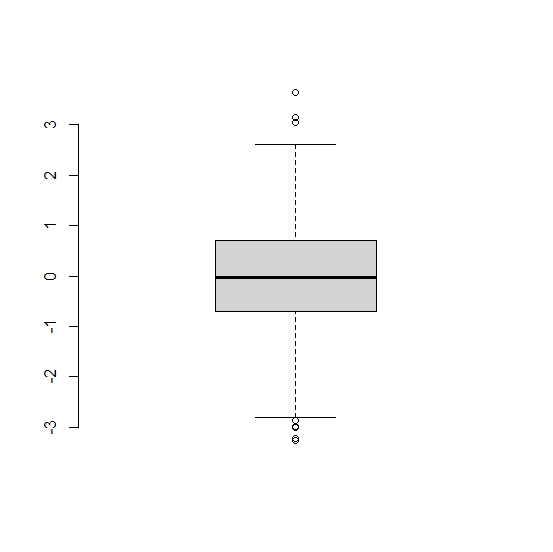
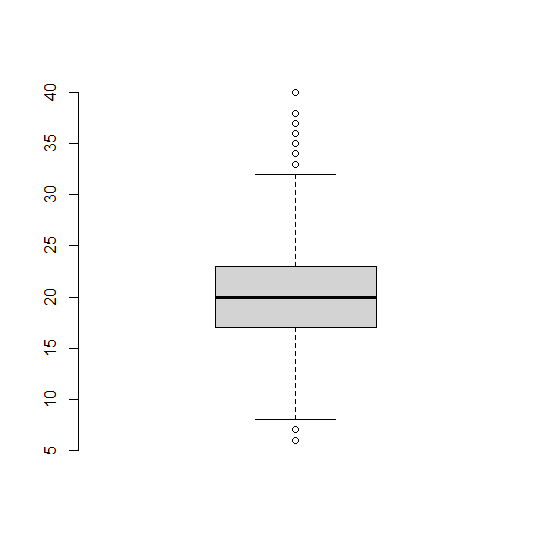
Example2
> y<-rpois(5000,20)
> boxplot(y,frame.plot=FALSE)
Output:
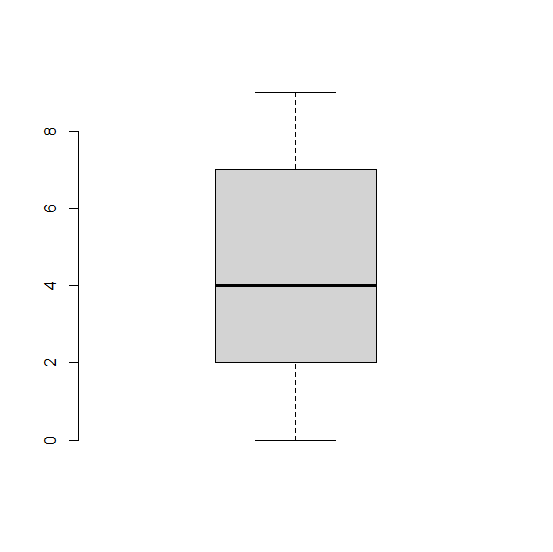
Example3
> z<-sample(0:9,500,replace=TRUE)
> boxplot(z,frame.plot=FALSE)
Output:

Updated on: 2020-11-23T09:58:12+05:30
393 Views

Advertisements