
Article Categories
- All Categories
-
 Data Structure
-
 Networking
-
 RDBMS
RDBMS
-
 Operating System
-
 Java
Java
-
 MS Excel
-
 iOS
iOS
-
 HTML
HTML
-
 CSS
CSS
-
 Android
-
 Python
-
 C Programming
-
 C++
C++
-
 C#
C#
-
 MongoDB
-
 MySQL
MySQL
-
 Javascript
-
 PHP
PHP
-
 Economics & Finance
Selected Reading
How to change the position of the title of a plot which is created using plot function in R?
When we create a plot using plot function, the title of the plot appears on top of the plot while using main argument. If we use title function to create the title of the plot then we can adjust its position in many different ways such as any position between below and top border of the plot.
Examples
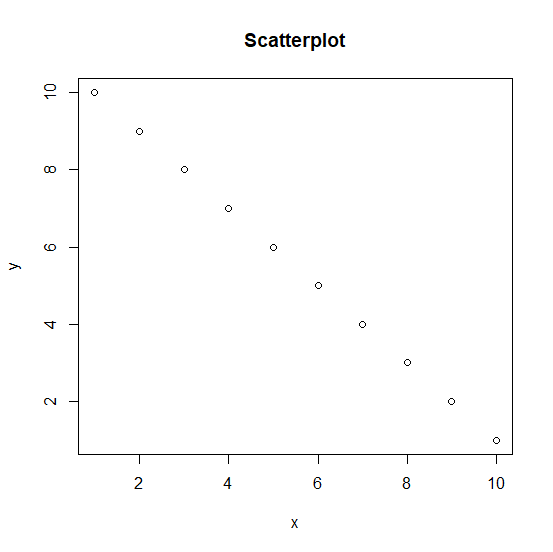
x <-1:10
y <-10:1
plot(x,y,main="Scatterplot")
Output
Example
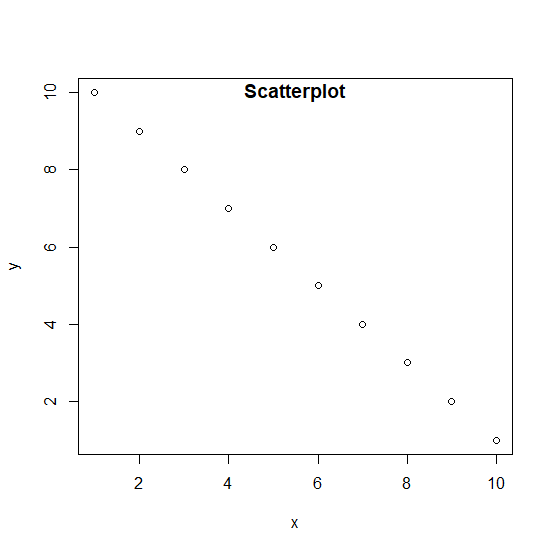
plot(x,y)
title("Scatterplot",line=-1)
Output
Example
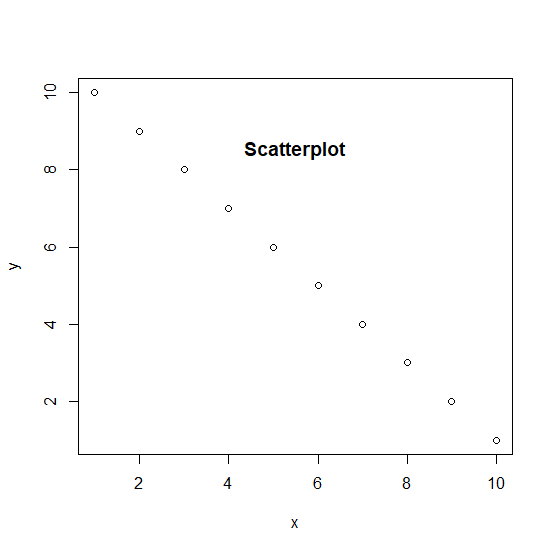
plot(x,y)
title("Scatterplot",line=-4)
Output
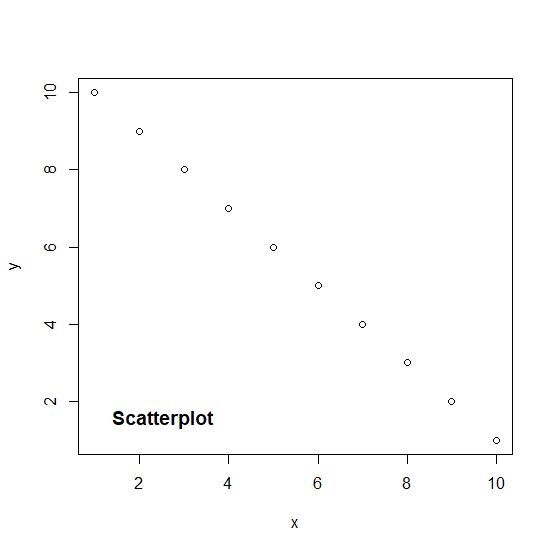
Example
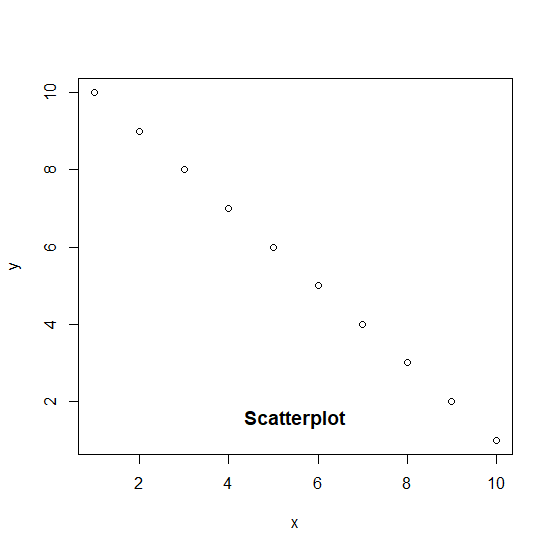
plot(x,y)
title("Scatterplot",line=-18)
Output
Example
plot(x,y)
title("Scatterplot",line=-18,adj=0.1)
Output

Updated on: 2020-08-24T11:27:31+05:30
1K+ Views

Advertisements