
Article Categories
- All Categories
-
 Data Structure
-
 Networking
-
 RDBMS
RDBMS
-
 Operating System
-
 Java
Java
-
 MS Excel
-
 iOS
iOS
-
 HTML
HTML
-
 CSS
CSS
-
 Android
-
 Python
-
 C Programming
-
 C++
C++
-
 C#
C#
-
 MongoDB
-
 MySQL
MySQL
-
 Javascript
-
 PHP
PHP
-
 Economics & Finance
Selected Reading
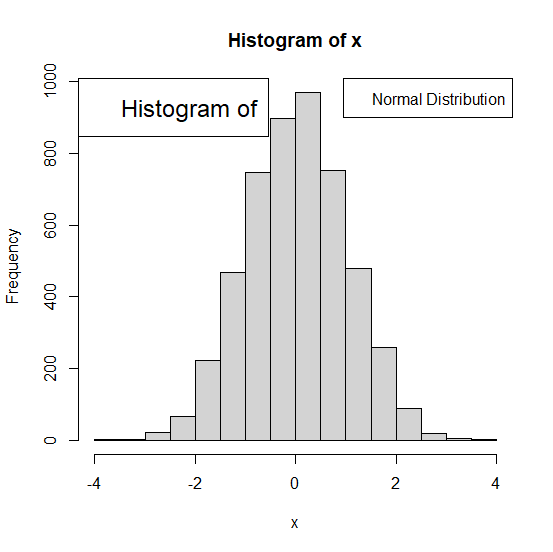
How to change the font size of legend in base R plot?
In base R, we can use legend function to add a legend to the plot. For example, if we want to create a histogram with legend on top-right position then we can use legend("topright",legend="Normal Distribution") and if we want to change the font size then we need to as cex argument as shown below:
legend("topright",legend="Normal Distribution",cex=2)
Example
legend("topleft",legend="Histogram of",cex=1.5)
Output

Updated on: 2026-03-11T23:22:53+05:30
3K+ Views

Advertisements