
Article Categories
- All Categories
-
 Data Structure
-
 Networking
-
 RDBMS
RDBMS
-
 Operating System
-
 Java
Java
-
 MS Excel
-
 iOS
iOS
-
 HTML
HTML
-
 CSS
CSS
-
 Android
-
 Python
-
 C Programming
-
 C++
C++
-
 C#
C#
-
 MongoDB
-
 MySQL
MySQL
-
 Javascript
-
 PHP
PHP
-
 Economics & Finance
Selected Reading
How to change the figuresize using Seaborn factorplot in Matplotlib?
To change the figuresize using Seaborn factorplot, we can take the following Steps −
Load the exercise data using load_dataset() method.
Using factorplot() method, change figure size by customising the size and aspect values.
To display the figure, use the show() method.
Example
import seaborn as sns
from matplotlib import pyplot as plt
plt.rcParams["figure.figsize"] = [7.50, 3.50]
plt.rcParams["figure.autolayout"] = True
exercise = sns.load_dataset("exercise")
sns.factorplot("kind", "pulse", "diet", exercise, kind="point", size=5, aspect=2)
plt.show()
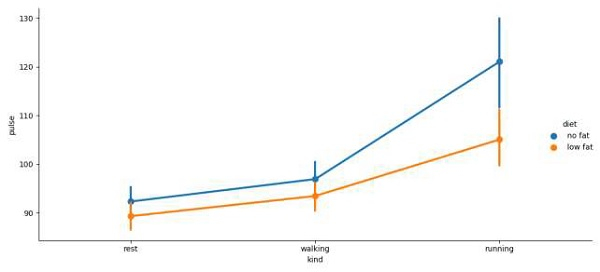
Output

Updated on: 2021-04-09T12:19:43+05:30
485 Views

Advertisements