
Article Categories
- All Categories
-
 Data Structure
-
 Networking
-
 RDBMS
RDBMS
-
 Operating System
-
 Java
Java
-
 MS Excel
-
 iOS
iOS
-
 HTML
HTML
-
 CSS
CSS
-
 Android
-
 Python
-
 C Programming
-
 C++
C++
-
 C#
C#
-
 MongoDB
-
 MySQL
MySQL
-
 Javascript
-
 PHP
PHP
-
 Economics & Finance
How to change the border line type in base R boxplot?
The default boxplot in R has straight border line type that display end point(s) excluding outliers. To change these border lines from a boxplot, we can use staplelty argument.
For Example, if we have a vector called X then we can create the boxplot of X with different border line type by using the command boxplot(X,staplelty=15). The argument can take different values. Check out the below Examples to understand how it works.
Example
Consider the below vector −
x<-rnorm(15)
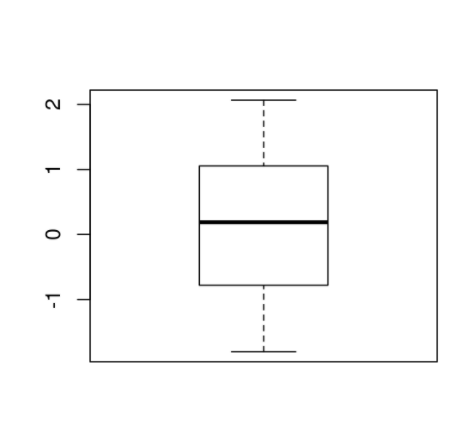
To create a boxplot of x, add the following code to the above snippet −
x<-rnorm(15)
boxplot(x)
Output
If you execute the above given snippet, it generates the following Output −
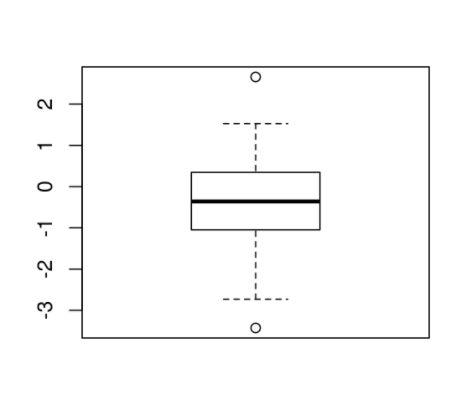
To create a boxplot of x with different border lines, add the following code to the above snippet −
x<-rnorm(15)
boxplot(x,staplelty=2)
Output
If you execute all the above given snippets as a single program, it generates the following Output −
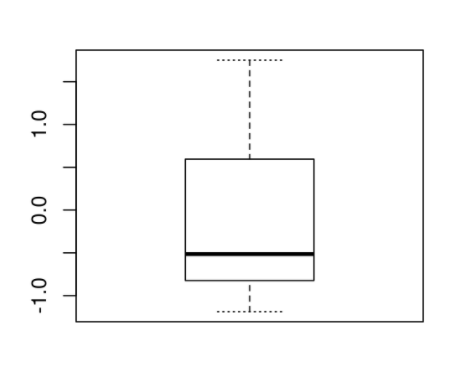
Add the following code to the above snippet −
x<-rnorm(15)
boxplot(x,staplelty=15)
Output
If you execute all the above given snippets as a single program, it generates the following Output −

920 Views
