
Article Categories
- All Categories
-
 Data Structure
-
 Networking
-
 RDBMS
RDBMS
-
 Operating System
-
 Java
Java
-
 MS Excel
-
 iOS
iOS
-
 HTML
HTML
-
 CSS
CSS
-
 Android
-
 Python
-
 C Programming
-
 C++
C++
-
 C#
C#
-
 MongoDB
-
 MySQL
MySQL
-
 Javascript
-
 PHP
PHP
-
 Economics & Finance
Selected Reading
How to change the border color of points in a scatterplot created with ggplot2 in R?
Aesthetics is an essential part of a plot whether it is a scatterplot or any other plot. When we create a scatterplot with ggplot function of ggplot2 package, the border of the points is black if we fill the points with the sequence of a color but we can change these borders to any other color by using colour argument.
Example
Consider the below data frame
Rate <-1:10
Score <-10:1
S.no <-c(2,5,7,8,9,12,15,18,25,27)
df <-data.frame(Rate,Score,S.no)
df
Output
Rate Score S.no
1 1 10 2
2 2 9 5
3 3 8 7
4 4 7 8
5 5 6 9
6 6 5 12
7 7 4 15
8 8 3 18
9 9 2 25
10 10 1 27
> library(ggplot2)
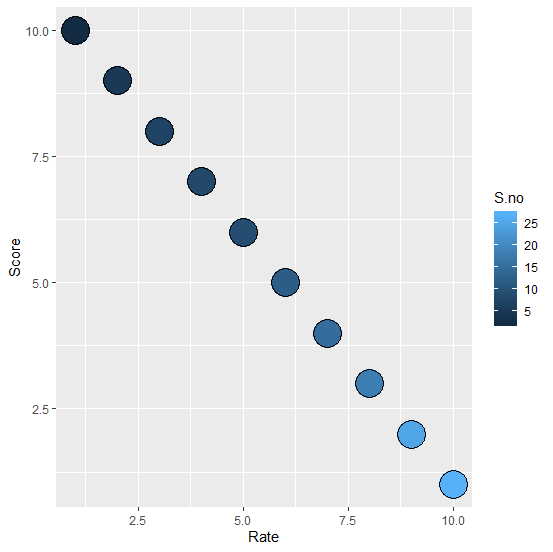
Creating the scatterplot without defining border color −
ggplot(df,aes(Rate,Score))+geom_point(aes(fill=S.no),pch=21,size=10)
Output
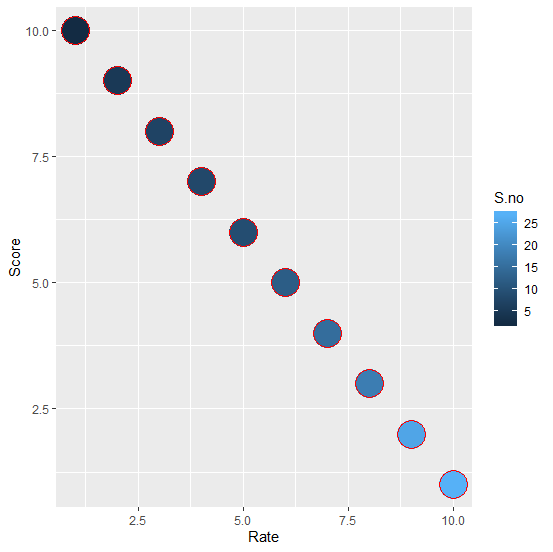
Creating the scatterplot with red border color −
ggplot(df,aes(Rate,Score))+geom_point(aes(fill=S.no),pch=21,size=10,colour="red")
Output
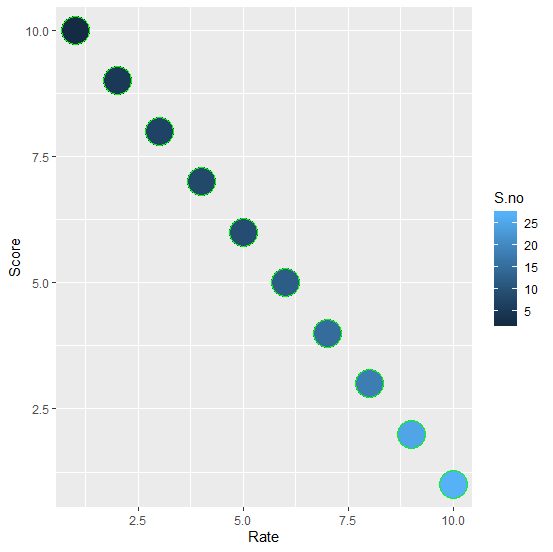
Creating the scatterplot with green border color −
ggplot(df,aes(Rate,Score))+geom_point(aes(fill=S.no),pch=21,size=10,colour="green")
Output

Updated on: 2020-08-21T11:34:02+05:30
3K+ Views

Advertisements