
Article Categories
- All Categories
-
 Data Structure
-
 Networking
-
 RDBMS
RDBMS
-
 Operating System
-
 Java
Java
-
 MS Excel
-
 iOS
iOS
-
 HTML
HTML
-
 CSS
CSS
-
 Android
-
 Python
-
 C Programming
-
 C++
C++
-
 C#
C#
-
 MongoDB
-
 MySQL
MySQL
-
 Javascript
-
 PHP
PHP
-
 Economics & Finance
Selected Reading
How to change the background color of a plot created by using plot function in R?
To change the focus of a plot we can do multiple things and one such thing is changing the background of the plot. If the background color of a plot is different than white then obviously it will get attention of the readers because this is unusual as most of the times the plots have white backgrounds, hence if we want to attract readers on the plot then we might use this technique. It can be done by using par(bg= "color_name").
Example
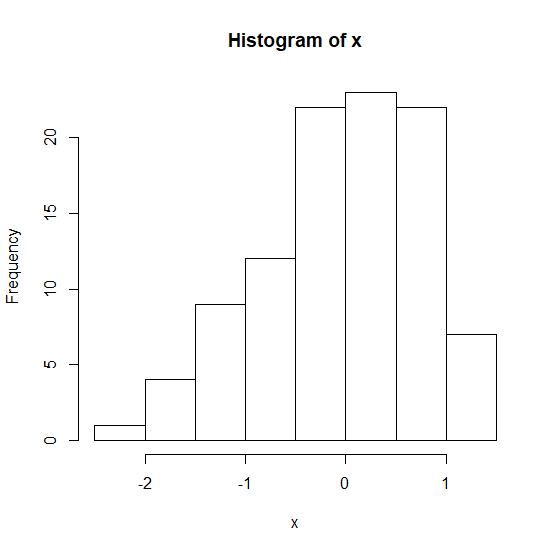
Creating a simple histogram −
> x<-rnorm(100)
> hist(x)
Output
Example
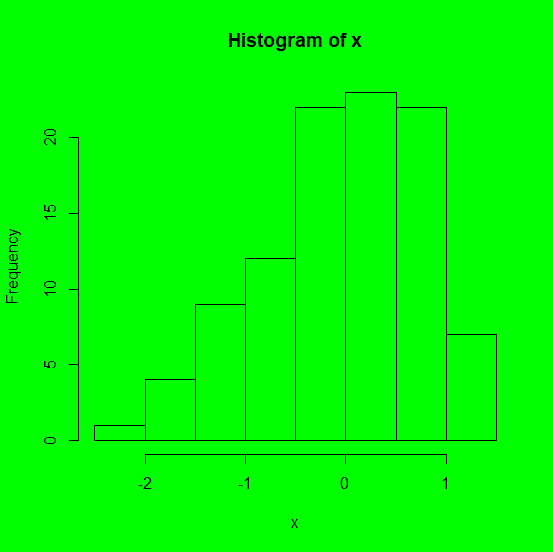
Creating histogram with different background colors −
> par(bg="green")
> hist(x)
Output
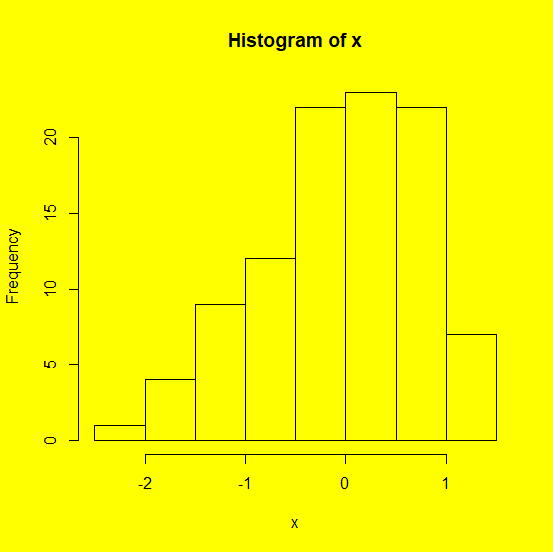
> par(bg="yellow")
> hist(x)
Output
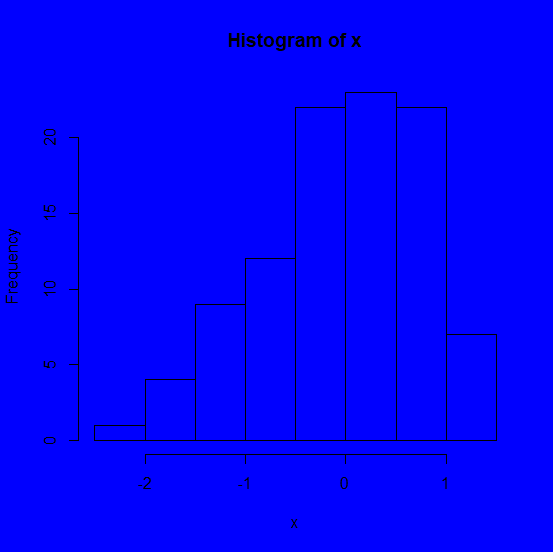
par(bg="blue")
> hist(x)
Output

Updated on: 2026-03-11T22:50:51+05:30
1K+ Views

Advertisements