
Article Categories
- All Categories
-
 Data Structure
-
 Networking
-
 RDBMS
RDBMS
-
 Operating System
-
 Java
Java
-
 MS Excel
-
 iOS
iOS
-
 HTML
HTML
-
 CSS
CSS
-
 Android
-
 Python
-
 C Programming
-
 C++
C++
-
 C#
C#
-
 MongoDB
-
 MySQL
MySQL
-
 Javascript
-
 PHP
PHP
-
 Economics & Finance
Selected Reading
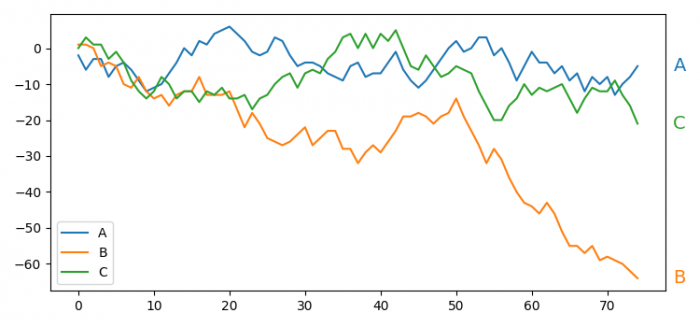
How to annotate the end of lines using Python and Matplotlib?
To annotate the end of lines using Python and Matplotlib, we can add text labels at the end points of plotted lines. This is particularly useful for line charts where you want to identify each line without relying solely on legends.
Steps to Annotate Line Endpoints
- Set the figure size and adjust the padding between and around the subplots
- Initialize a variable, rows, to get the number of rows data
- Get a Pandas dataframe with rectangular tabular data
- Calculate the cumsum (cumulative sum) of the dataframe
- Plot the dataframe using plot() method
- Iterate through line and name to annotate the end of lines
- Use annotate() method with column's name, xy coordinates, color of the lines, sizes, etc.
- Place a legend on the figure
- To display the figure, use show() method
Example
Here's a complete example that creates a line plot with annotations at the end of each line −
import pandas as pd
import numpy as np
import matplotlib.pyplot as plt

plt.rcParams["figure.figsize"] = [7.50, 3.50]
plt.rcParams["figure.autolayout"] = True

rows = 75

df = pd.DataFrame(np.random.randint(-5, 5, size=(rows, 3)),
                  columns=['A', 'B', 'C'])
df = df.cumsum()
ax = df.plot()

for line, name in zip(ax.lines, df.columns):
    y = line.get_ydata()[-1]
    ax.annotate(name, xy=(1, y), xytext=(6, 0),
                color=line.get_color(), xycoords=ax.get_yaxis_transform(),
                textcoords="offset points", size=14, va="center")

plt.legend(loc='lower left')
plt.show()
How It Works
The key part is the annotation loop that iterates through each plotted line −
- line.get_ydata()[-1] − Gets the last y-value of each line
- xy=(1, y) − Places annotation at the right edge (x=1) and the line's final y-value
- xycoords=ax.get_yaxis_transform() − Uses axis coordinates where x=1 represents the right edge
- xytext=(6, 0) − Offsets the text 6 points to the right
- color=line.get_color() − Matches the annotation color to the line color
Output
Conclusion
Using annotate() with axis transforms allows you to place labels at line endpoints effectively. The combination of xycoords=ax.get_yaxis_transform() and xy=(1, y) ensures annotations appear at the right edge regardless of the actual x-axis values.

Updated on: 2026-03-25T23:07:06+05:30
1K+ Views

Advertisements