
Article Categories
- All Categories
-
 Data Structure
-
 Networking
-
 RDBMS
RDBMS
-
 Operating System
-
 Java
Java
-
 MS Excel
-
 iOS
iOS
-
 HTML
HTML
-
 CSS
CSS
-
 Android
-
 Python
-
 C Programming
-
 C++
C++
-
 C#
C#
-
 MongoDB
-
 MySQL
MySQL
-
 Javascript
-
 PHP
PHP
-
 Economics & Finance
Selected Reading
How to add a picture to plot in base R?
To add a picture to a plot in base R, we first need to read the picture in the appropriate format and then rasterImage function can be used. The most commonly used format for picture in R is PNG. A picture in PNG format can be added to a plot by supplying the values in the plot where we want to add the picture.
Example
Loading png package:
> library(png)
Reading png file:
> Picture<-readPNG(system.file("img","Rlogo.png",package="png"))
Creating a blank plot:
> plot(1:10,ty="n")
Output:
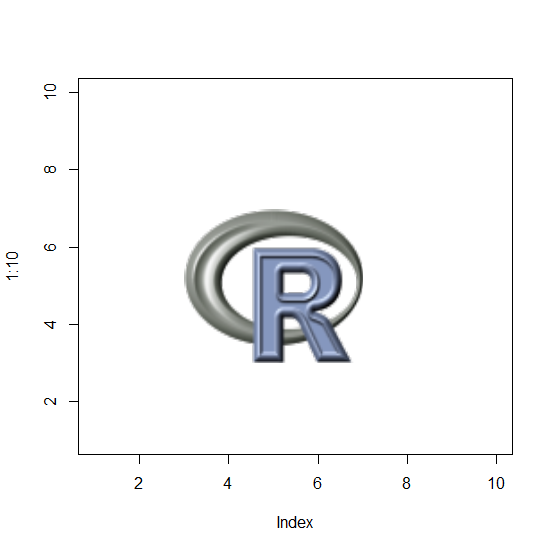
Adding the picture in png file to the above plot:
Example
> rasterImage(Picture,3,3,7,7)
Output:
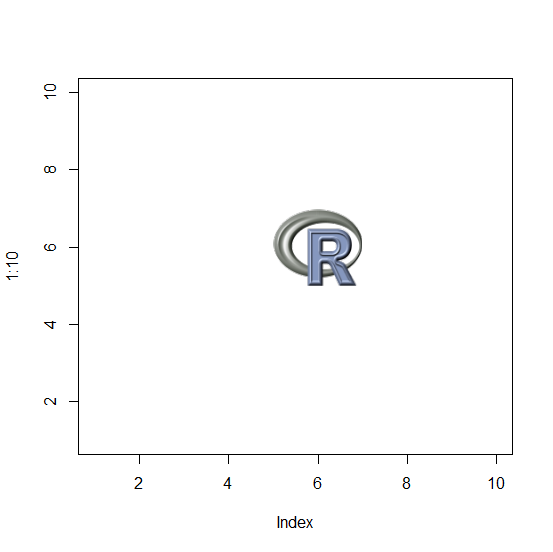
Example
> plot(1:10,ty="n")
> rasterImage(Picture,5,5,7,7)
Output:

Updated on: 2020-11-19T07:44:05+05:30
5K+ Views

Advertisements