
Article Categories
- All Categories
-
 Data Structure
-
 Networking
-
 RDBMS
RDBMS
-
 Operating System
-
 Java
Java
-
 MS Excel
-
 iOS
iOS
-
 HTML
HTML
-
 CSS
CSS
-
 Android
-
 Python
-
 C Programming
-
 C++
C++
-
 C#
C#
-
 MongoDB
-
 MySQL
MySQL
-
 Javascript
-
 PHP
PHP
-
 Economics & Finance
Selected Reading
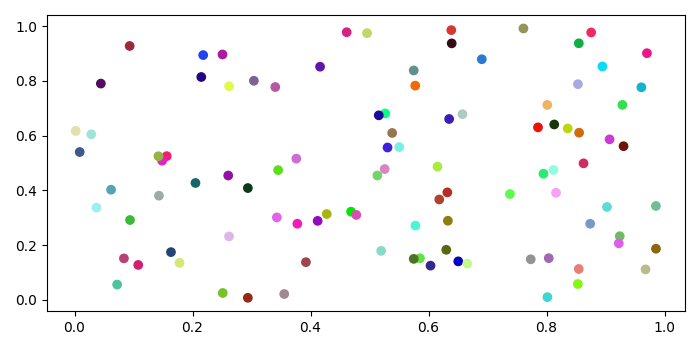
Fixing color in scatter plots in Matplotlib
To fix colors in scatter plots in matplotlib, we can take the following steps −
Create xs and ys random data points using numpy.
Create a set of colors using hexadecimal alpabets, equal to the length of ys.
Plot the lists, xs and ys, using scatter() method, with the list of colors.
To display the figure, use show() method.
Example
import random
import numpy as np
from matplotlib import pyplot as plt
plt.rcParams["figure.figsize"] = [7.00, 3.50]
plt.rcParams["figure.autolayout"] = True
xs = np.random.rand(100)
ys = np.random.rand(100)
colors = ["#" + ''.join([random.choice('0123456789ABCDEF') for j in range(6)])
for i in range(len(xs))]
plt.scatter(xs, ys, c=colors)
plt.show()
Output

Updated on: 2021-05-08T09:10:30+05:30
1K+ Views

Advertisements