
Article Categories
- All Categories
-
 Data Structure
-
 Networking
-
 RDBMS
RDBMS
-
 Operating System
-
 Java
Java
-
 MS Excel
-
 iOS
iOS
-
 HTML
HTML
-
 CSS
CSS
-
 Android
-
 Python
-
 C Programming
-
 C++
C++
-
 C#
C#
-
 MongoDB
-
 MySQL
MySQL
-
 Javascript
-
 PHP
PHP
-
 Economics & Finance
Selected Reading
Fill bars in a base R barplot with colors based on frequency.
Suppose we have a vector that contains only frequencies and we want to create a bar chart in base R using these frequencies with color of bars based on frequencies, therefore, we can use barplot function and providing the color of the bars with as shown in the below Examples
The function is as follows −
heat.colors function
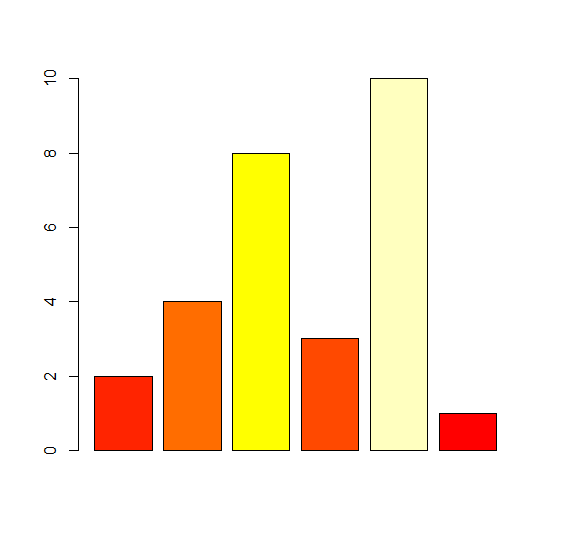
Example 1
To fill the bars in a base R barplot with colours based on frequency, use the command given below −
Frequency_1<-c(2,4,8,3,10,1)
barplot(Frequency_1,col=heat.colors(max(Frequency_1))[Frequency_1])
Output
If you execute the above given snippet, it generates the following Output −
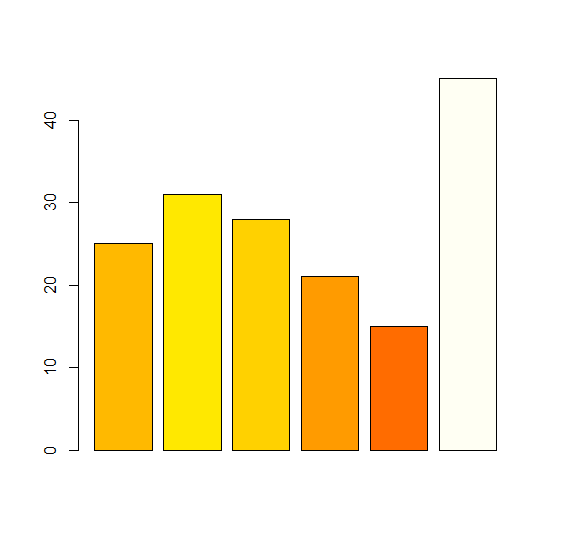
Example 2
To fill the bars in a base R barplot with colours based on frequency, use the command given below −
Frequency_2<-c(25,31,28,21,15,45)
barplot(Frequency_2,col=heat.colors(max(Frequency_2))[Frequency_2])
Output
If you execute the above given snippet, it generates the following Output −

Updated on: 2021-11-03T05:00:31+05:30
616 Views

Advertisements