
Article Categories
- All Categories
-
 Data Structure
-
 Networking
-
 RDBMS
RDBMS
-
 Operating System
-
 Java
Java
-
 MS Excel
-
 iOS
iOS
-
 HTML
HTML
-
 CSS
CSS
-
 Android
-
 Python
-
 C Programming
-
 C++
C++
-
 C#
C#
-
 MongoDB
-
 MySQL
MySQL
-
 Javascript
-
 PHP
PHP
-
 Economics & Finance
Selected Reading
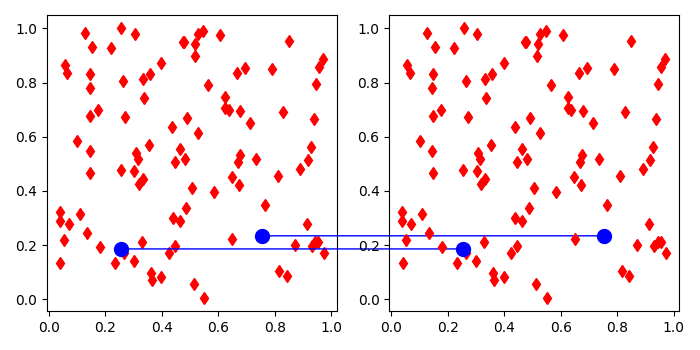
Drawing lines between two plots in Matplotlib
To draw lines between two plots in matplotlib, we can take the following steps −
Create a new figure or activate an existing figure.
Add two axes (ax1 and ax2) to the figure as part of a subplot arrangement.
Create random data x and y using numpy.
Plot x and y data points on both the axes (ax1 and ax2) with color=red and marker=diamond.
Initialize two variables, i and j to get the diffirent data points on the subplot.
Make xy and mn tuple for positions to add a patch on the subplots.
Add a patch that connects two points (possibly in different axes), con1 and con2.
Add artists for con1 and con2.
Plot lines on ax1 and ax2 with data points (x[i], y[i]) and (x[j], y[j]), to interlink the patches.
To display the figure, use show() method.
Example
import matplotlib.pyplot as plt
from matplotlib.patches import ConnectionPatch
import numpy as np
plt.rcParams["figure.figsize"] = [7.00, 3.50]
plt.rcParams["figure.autolayout"] = True
fig = plt.figure()
ax1 = fig.add_subplot(121)
ax2 = fig.add_subplot(122)
x, y = np.random.rand(100), np.random.rand(100)
ax1.plot(x, y, 'd', c='r')
ax2.plot(x, y, 'd', c='r')
i = 10
xy = (x[i], y[i])
con1 = ConnectionPatch(xyA=xy, xyB=xy, coordsA="data", coordsB="data", axesA=ax2, axesB=ax1, color="blue")
j = 12
mn = (x[j], y[j])
con2 = ConnectionPatch(xyA=mn, xyB=mn, coordsA="data", coordsB="data", axesA=ax2, axesB=ax1, color="blue")
ax2.add_artist(con1)
ax2.add_artist(con2)
ax1.plot(x[i], y[i], 'bo', markersize=10)
ax2.plot(x[i], y[i], 'bo', markersize=10)
ax1.plot(x[j], y[j], 'bo', markersize=10)
ax2.plot(x[j], y[j], 'bo', markersize=10)
plt.show()
Output

Updated on: 2021-05-08T09:32:42+05:30
3K+ Views

Advertisements