
Article Categories
- All Categories
-
 Data Structure
-
 Networking
-
 RDBMS
RDBMS
-
 Operating System
-
 Java
Java
-
 MS Excel
-
 iOS
iOS
-
 HTML
HTML
-
 CSS
CSS
-
 Android
-
 Python
-
 C Programming
-
 C++
C++
-
 C#
C#
-
 MongoDB
-
 MySQL
MySQL
-
 Javascript
-
 PHP
PHP
-
 Economics & Finance
Selected Reading
Defining the midpoint of a colormap in Matplotlib
Using plt.subplots(1, 1) method, we can create fig and axis. We can use fig.colorbar to make the color bar at the midpoint of the figure.
Steps
Using mgrid() method, `nd_grid` instance which returns an open multi-dimensional "meshgrid".
Create Z1, Z2 and Z data.
Create fig and ax variables using subplots method, where default nrows and ncols are 1, using subplots() method.
Create a colorbar for a ScalarMappable instance, *mappable*, using colorbar() method.
Using plt.show(), we can show the figure.
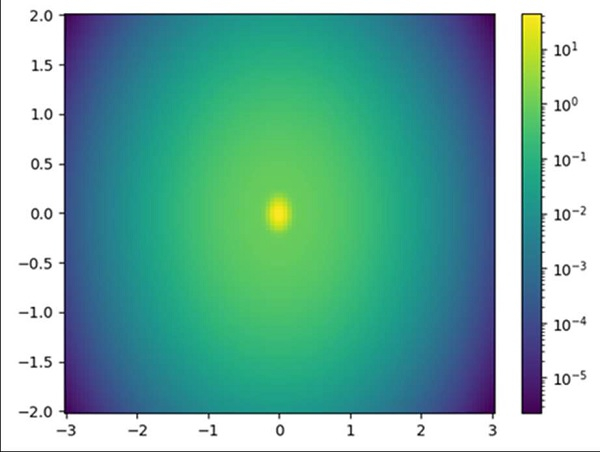
Example
import numpy as np
import matplotlib.pyplot as plt
import matplotlib.colors as colors

N = 100
X, Y = np.mgrid[-3:3:complex(0, N), -2:2:complex(0, N)]

Z1 = np.exp(-(X)**2 - (Y)**2)
Z2 = np.exp(-(X * 10)**2 - (Y * 10)**2)
Z = Z1 + 50 * Z2

fig, ax = plt.subplots(1, 1)

fig.colorbar(ax.pcolor(X, Y, Z, norm=colors.LogNorm(vmin=Z.min(),
vmax=Z.max()), shading='auto'))
plt.show()
Output

Updated on: 2021-03-16T10:11:07+05:30
480 Views

Advertisements