
Article Categories
- All Categories
-
 Data Structure
-
 Networking
-
 RDBMS
RDBMS
-
 Operating System
-
 Java
Java
-
 MS Excel
-
 iOS
iOS
-
 HTML
HTML
-
 CSS
CSS
-
 Android
-
 Python
-
 C Programming
-
 C++
C++
-
 C#
C#
-
 MongoDB
-
 MySQL
MySQL
-
 Javascript
-
 PHP
PHP
-
 Economics & Finance
Selected Reading
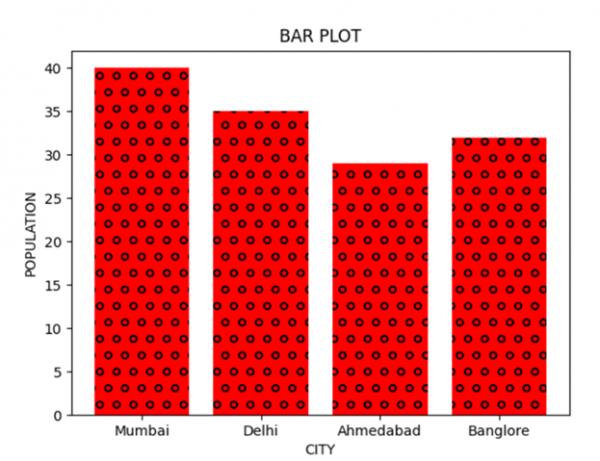
Adding textures to graphs using Matplotlib
In this program, we will plot a bar graph using the matplotlib library. The most important Step in solving matplotlib related problems using the matplotlib library is importing the matplotlib library. The syntax is:
import matplotlib.pyplot as plt
Pyplot is a collection of command style functions that make Matplotlib work like MATLAB. In addition to plotting the bar graphs, we will also add some textures to the graphs. The 'hatch' parameter in the bar() function is used to define the texture of the bar
Algorithm
Step 1: Define a list of values.
Step 2: Use the bar() function and define parameters like xaxis, yaxis, hatch.
Step 3: Plot the graph.
Example Code
import matplotlib.pyplot as plt

data_x = ['Mumbai', 'Delhi', 'Ahmedabad', 'Banglore']
data_y = [40, 35, 29, 32]

plt.xlabel("CITY")
plt.ylabel("POPULATION")
plt.title("BAR PLOT")
plt.bar(data_x, data_y, color='red', hatch = 'o')
plt.show()
Output

Updated on: 2021-03-16T11:07:40+05:30
692 Views

Advertisements