- Apache Presto - Home
- Apache Presto - Overview
- Apache Presto - Architecture
- Apache Presto - Installation
- Apache Presto - Configuration
- Apache Presto - Administration
- Apache Presto - SQL Operations
- Apache Presto - SQL Functions
- Apache Presto - MySQL Connector
- Apache Presto - JMX Connector
- Apache Presto - HIVE Connector
- Apache Presto - KAFKA Connector
- Apache Presto - JDBC Interface
- Custom Function Application
Apache Presto - Administration Tools
In this chapter, we will discuss the administration tools used in Presto. Lets start with the Web Interface of Presto.
Web Interface
Presto provides a web interface for monitoring and managing queries. It can be accessed from the port number specified in the coordinator Config Properties.
Start Presto server and Presto CLI. Then you can access the web interface from the following url − http://localhost:8080/
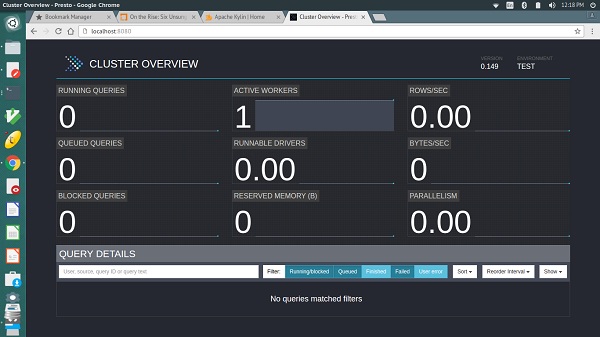
The output will be similar to the above screen.
Here, the main page has a list of queries along with information like unique query ID, query text, query state, percentage completed, username and source from which this query is originated. Latest queries are running first, then completed or not completed queries are displayed at the bottom.
Tuning the Performance on Presto
If Presto cluster is having any performance-related issues, change your default configuration settings to the following settings.
Config Properties
task. info -refresh-max-wait − Reduces coordinator work load.
task.max-worker-threads − Splits the process and assigns to each worker nodes.
distributed-joins-enabled − Hash-based distributed joins.
node-scheduler.network-topology − Sets network topology to scheduler.
JVM Settings
Change your default JVM settings to the following settings. This will be helpful for diagnosing garbage collection issues.
-XX:+PrintGCApplicationConcurrentTime
-XX:+PrintGCApplicationStoppedTime
-XX:+PrintGCCause
-XX:+PrintGCDateStamps
-XX:+PrintGCTimeStamps
-XX:+PrintGCDetails
-XX:+PrintReferenceGC
-XX:+PrintClassHistogramAfterFullGC
-XX:+PrintClassHistogramBeforeFullGC
-XX:PrintFLSStatistics = 2
-XX:+PrintAdaptiveSizePolicy
-XX:+PrintSafepointStatistics
-XX:PrintSafepointStatisticsCount = 1
